Open Position Details
Return to Overview
To access the quantitative model/report, click on 'Dashboard' from the navigation sidebar on the left. Select the model/report from the drop-down list and click 'Create'. Click on the 'Settings' button (gear icon) at the top right corner of the model to set up your model/report.
About
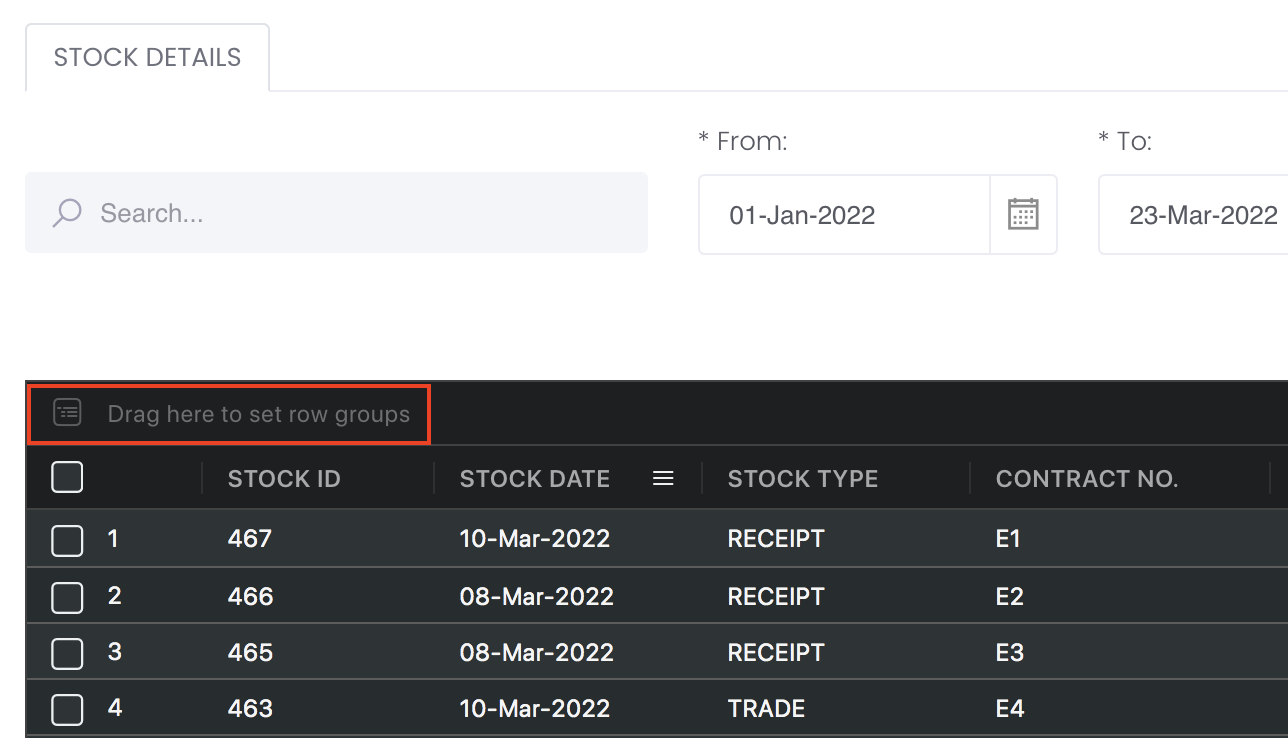
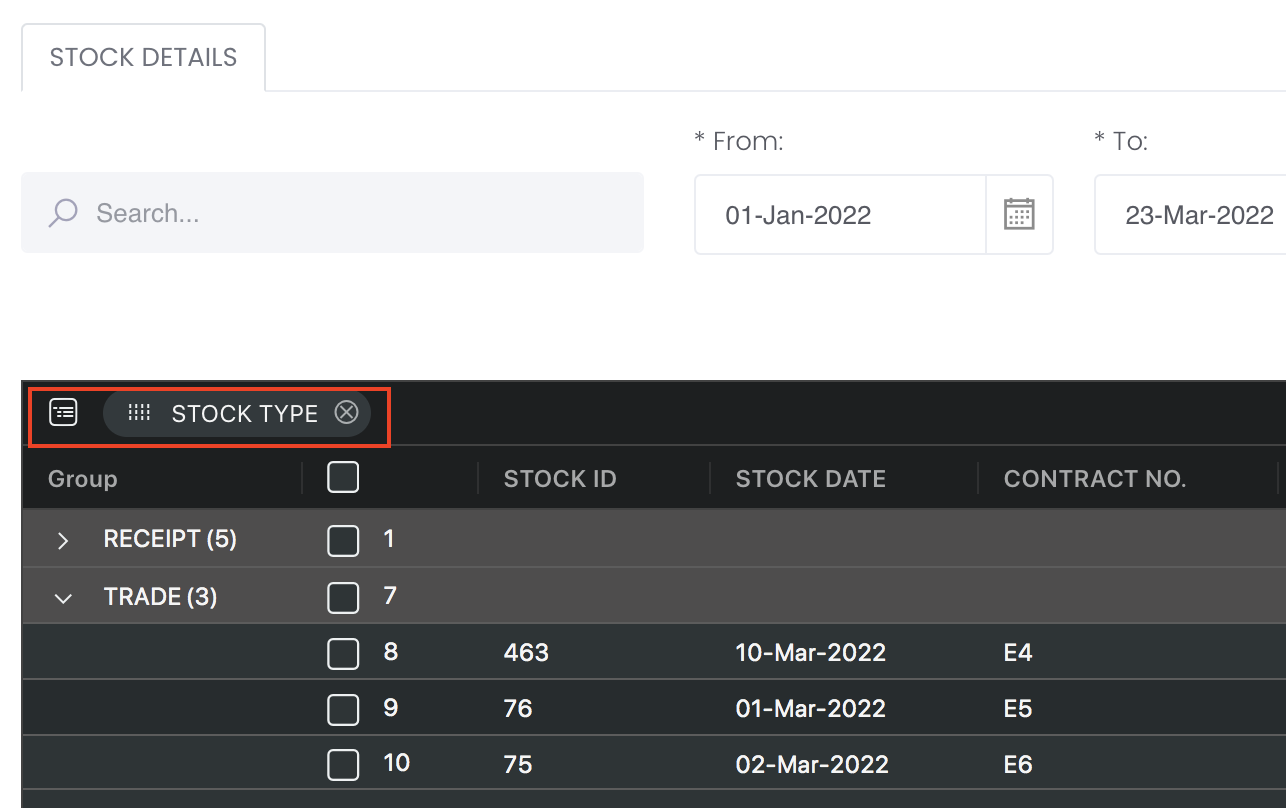
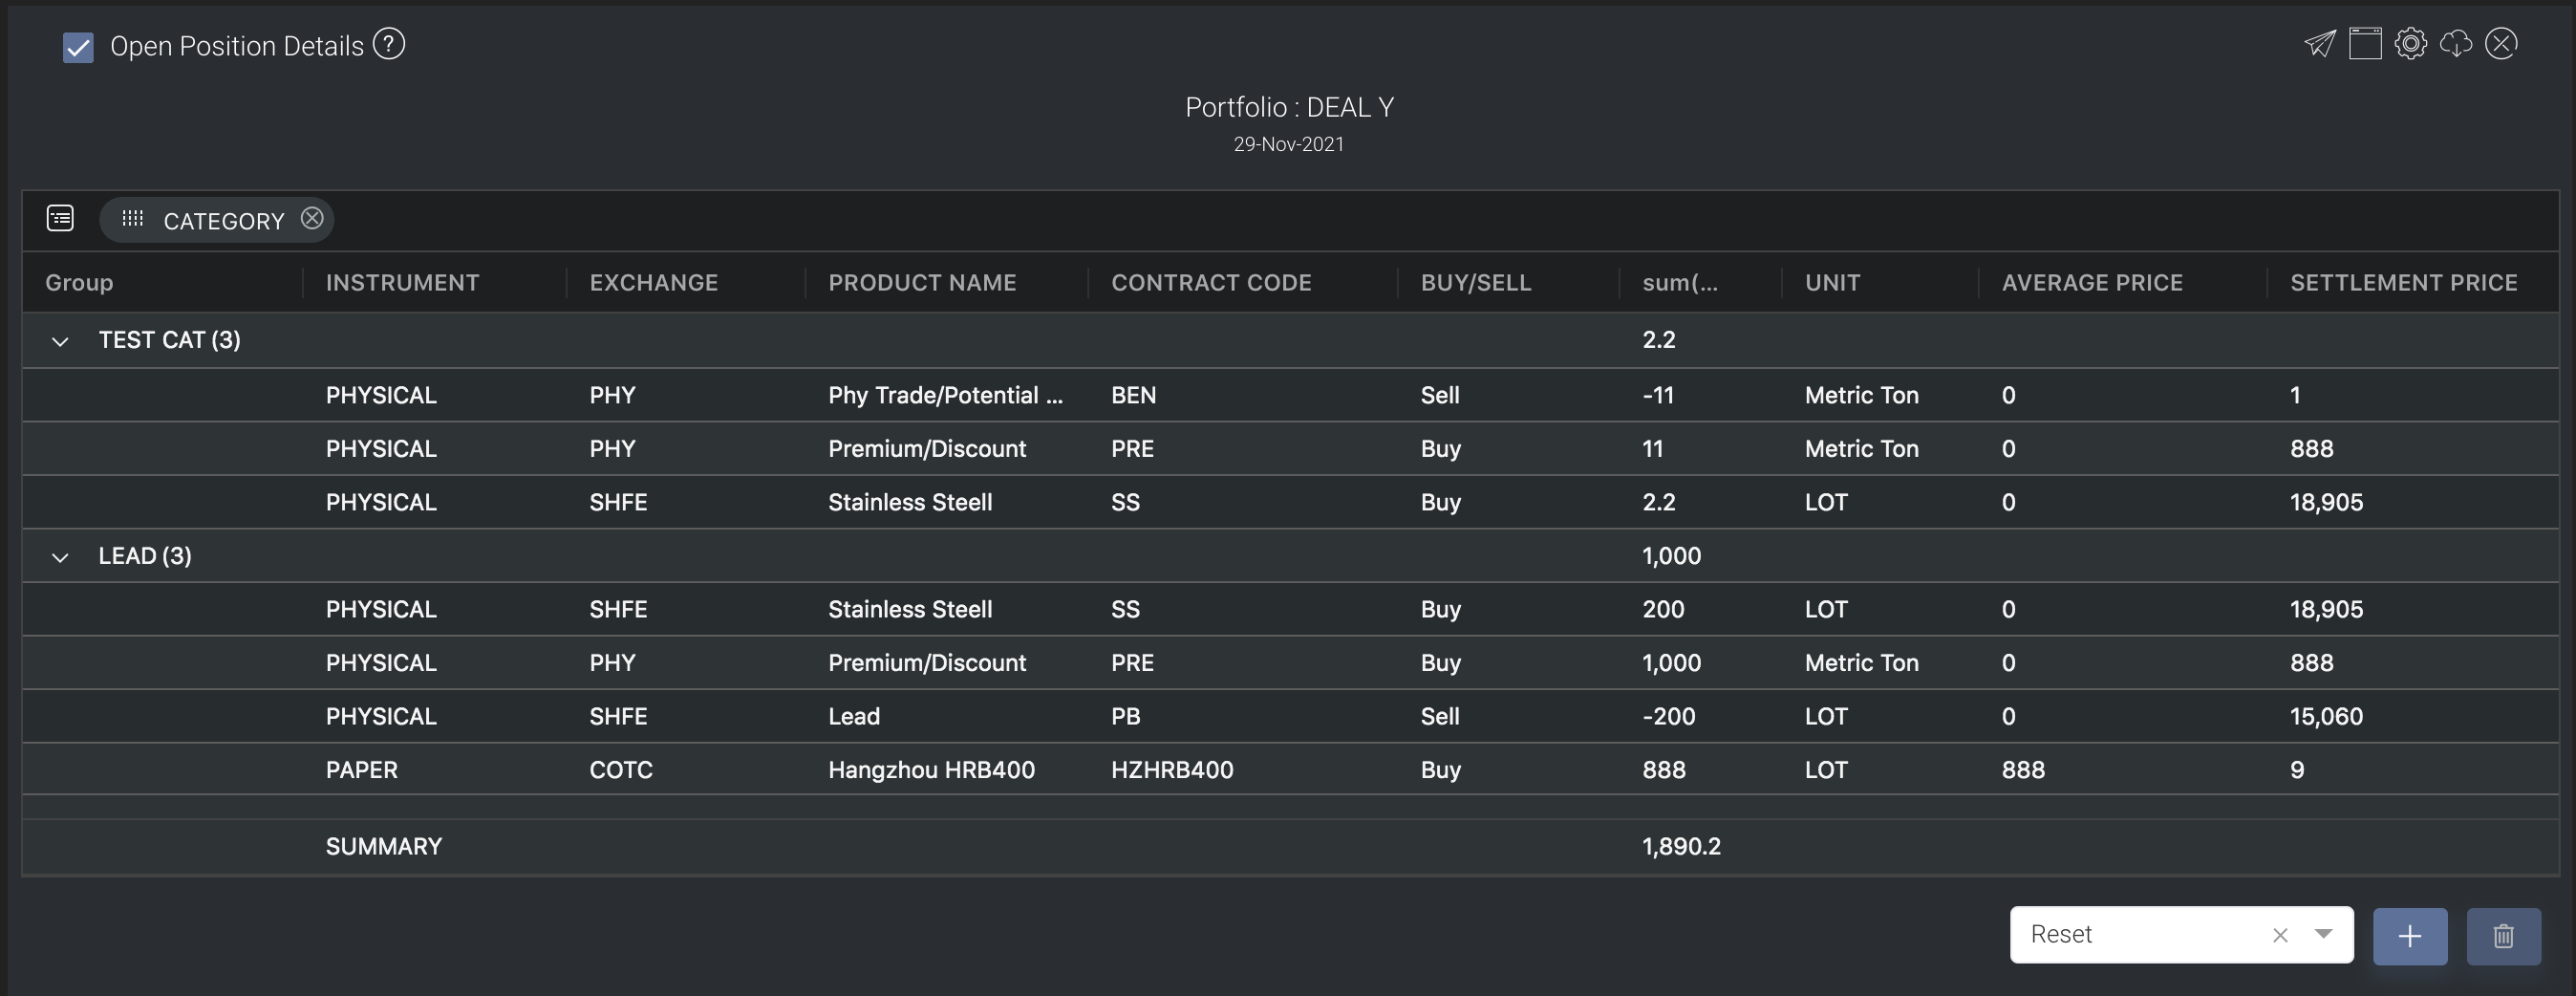
The Open Position Details model is obtained directly from the Open Positions Table in View Portfolio page for you to view all the open positions directly in the Dashboard. To categorise the trades according to your needs, you can reorganise your data by dragging-and-dropping the columns at the top of the table to 'set row groups'. Columns like daily change in P/L, commission and expenses/income will be summed up accordingly.
Navigation
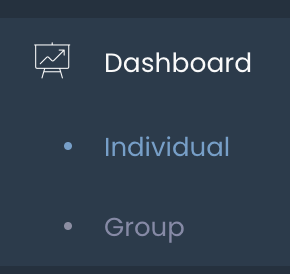
To access the quantitative model/report, click on 'Dashboard' from the navigation sidebar on the left.
Select the model/report from the drop-down list and click 'Create'. Click on the 'Settings' button (gear icon) at the top right corner of the model to set up your model/report.
Sharing Model/Report/Dashboard
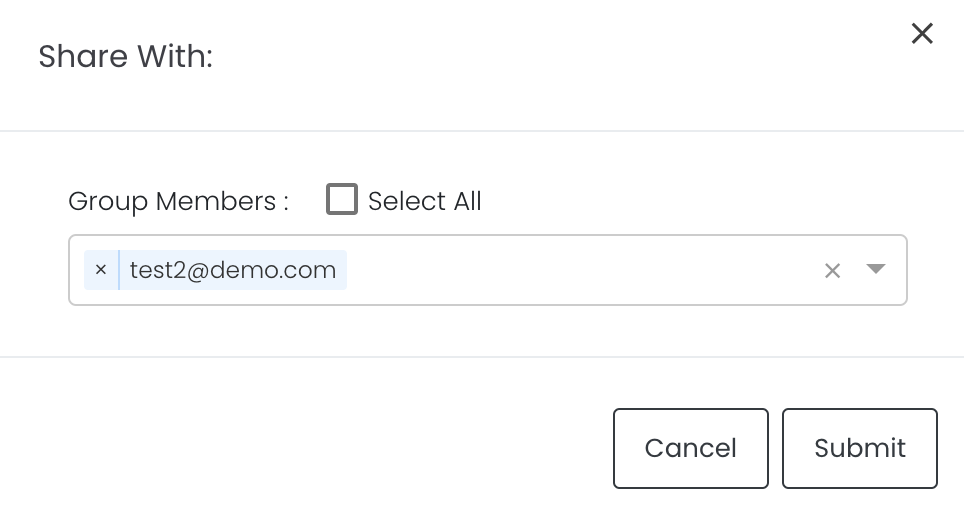
To share the model with your group members, click on the "Share" button next to the Title of the model followed by the email address of the group members you want to share it with. Once submitted, the model will appear in the Dashboard>Group Dashboard of the selected group members.
This is different from sharing individual or entire Dashboard models/reports, which allows any user who may or may not be users of MAF Cloud to access the individual model/entire dashboard via the shared web link (link will expire in 8 hours). In Group Dashboard, only group members can access the shared models/reports.
Group Rows
You may also group the rows (liken to the pivot table function in Microsoft Excel) to view the grouped data by dragging any column headers into the “row groups” section as highlighted:
The 'Open Positions' table consists of all the open positions in the portfolio (ie. position is 1-sided: only 'buy' or 'sell'). You will be able to monitor the outstanding paper and physical trades which are not closed/completed here. To determine the 'Unrealised P/L' value, UNPL = (Settlement Price - Purchase Price) * Contract Size * Size, where 'Purchase Price' = 'Average Price' in system.
When a trade position has been created or closed, its corresponding portfolio will be automatically updated and this table will reflect the latest changes, allowing you to monitor your positions immediately and accurately.
If the purchase and sale contracts have slightly differing Actual Quantity, the system will auto-close the trades, so the trades will be shown in the Closed Positions table instead.
Actual Price: If 'Actual Price' is empty, the system will use 'Estimated Price' in the portfolio calculations. If 'Actual Price' is input, the system will use 'Actual Price' in the portfolio calculations.
Priced In: 'PRICED IN' column will show 'TRUE' and provide a clear indication if 'Estimated Price' or 'Actual Price' in trade execution page has been input, and show 'FALSE' if 'Estimated Price' or 'Actual Price' in trade execution page has NOT been input.
Trades Remaining as Open Positions:
Trades with different CATEGORY and TRADER names will not be combined/closed off.
Please note that once 'Title Transfer Date' and 'Estimated Price' have been input in the trade execution page for both purchase and sale trades, the trade will remain in Open Positions table as unrealised P/L. But once 'Title Transfer Date' and 'Actual Price' have been input in the trade execution page, the trade will move from Open Positions table to Closed Positions table. Otherwise, the trade will remain in Open Positions table as unrealised P/L.
If ACTUAL PRICE has been input but 'Title Transfer Date' is still empty, it will be considered as an OPEN POSITION (trade will appear in OPEN POSITION table) and PRICED IN will be TRUE.
If ACTUAL PRICE has not been input but 'Title Transfer Date' is filled/not filled, it will be considered as an OPEN POSITION (trade will appear in OPEN POSITION table) and PRICED IN will be FALSE.
If ACTUAL PRICE has been input and 'Title Transfer Date' is filled, it will be considered closed and the trade will appear in the CLOSED POSITION table and PRICED IN will be TRUE.
If ESTIMATED PRICE has been input but ACTUAL PRICE is not input, and 'Title Transfer Date' is filled/not filled, it will be considered as an OPEN POSITION (trade will appear in OPEN POSITION table) and PRICED IN will be TRUE.
In short, the trade will only be considered CLOSED if the ACTUAL PRICE and TITLE TRANSFER DATE are filled. Otherwise, the trade will remain in the OPEN POSITION table as unrealised P/L.
However, if the purchase and sale trades do not have the same Category, they will not close each other and will thus remain as open positions. If the actual quantity differs slightly, the positions will be closed accordingly.
Please also note that once you have updated the 'Actual Quantity' and 'Actual Price' in the trade execution of a trade, the trade will move from 'Open Positions' table to 'Closed Positions' table to reflect that the trade has been completed/closed on that quantity and price. For forwards contract, if the 'Valuation Date' of a trade has expired (any date before today's date), the trade will automatically be reflected in the 'Closed Positions' table based on the settlement price on the 'Valuation Date', unless the 'Actual Quantity' and 'Actual Price' are input in the trade execution page.
Title Transfer Date: Inputting 'Title Transfer Date' will replace 'Trade Date' in PORTFOLIO page (under TRADES table). If 'Title Transfer Date' is removed, the original 'Trade Date' will be displayed. 'Title Transfer Date' cannot be after Today's Date.
Unit: If the pricing mode of the physical trade position is not FIXED (which means it is either WMA, FLOAT/AVE or SPOT), the unit will be in LOTS. If the pricing mode is FIXED, the unit will be in the original units eg metric tons, barrels etc.
Options Contract: For options contract, forward options can be expired based on their value date, same as forward contract. So once it expired, it will become closed position. So in Counterparty Position Risk Summary app, it will only show open positions.
PVT Column: PVT column is added to Portfolio (Open Position table) and P/L Details model:
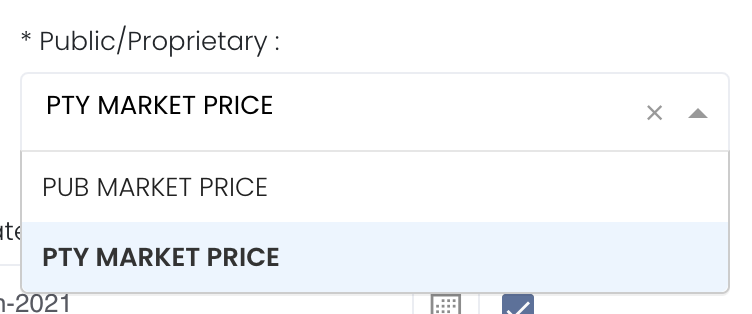
Shows PUB = trade is calculated using public data
Shows PROP = trade is calculated using proprietary/private data
Shows empty = Priced_In = true : trade has price (estimated/actual price) so column will be empty/blank
So to check if you have uploaded the correct proprietary (PVT) data, you can check the Settlement Date by sorting (click on the header name to sort). If the Settlement Date is not yesterday's date, it means that the data is not updated yet.
Aggregation Type: Positions displayed will change according to the 'Aggregation Type' selected under 'Portfolio Information'.
Trade Type: "BENCHMARK" refers to the benchmark pricing you set and "POTENTIAL" refers to the mark-to-market pricing you set when creating physical trades.
Size: For Float/WMA/Spot pricing mode, 'Size' in this table will be converted to "Lots" = Contract Quantity (found in physical trade's pricing page)/Product Size (found in product data table)
For example, if contract quantity is 500, and product size is 25 (Aluminium 3M), 'Size' = 500/25 = 20
Tax Rate: If you key in the tax rate in the create physical trades page, your P/L will be calculated excluding the tax rate. If you leave this field empty, your P/L will be calculated including the tax rate.
P/L = Contract Value / (1+tax rate %)
P/L Example: For paper trades, if product is lead, average price = 1, and size = 1, and settlement price = 15060. P/L = (15060 - 1)*5 = 75295
Note: For LME position, if the position is closed but prompt data (VALUATION DATE) is still not met yet, it will be treated as an OPEN POSITION (display in the OPEN POSITIONS table) but PRICED IN column will be TRUE.
For paper trades, if the trade has not been closed (eg sell 2, buy 1 so left with 1 qty), the closed quantity will appear in CLOSED POSITION table and the remaining open quantity will appear in OPEN POSITION table.
For example, buy sell LME Lead 3M contract, input trade date as 22 Nov, value date as 30 Nov; buy 10 lot at $3, sell 5 lots at $4. In portfolio, it will be displayed like this: first row will be the net buy and sales of 5 lots at $3 and $4. The remaining lots will be shown in the 2nd row.
Please refer to List of Definitions: Portfolio Details for more details.
Guide
Portfolio | Select a portfolio of interest. |
Select public market data or proprietary market data to determine the market data prices used to calculate the P/L or positions accordingly. Please note that if the proprietary (private) market data for certain dates are not input here eg 1 May to 10 May price is input but not 9 May, when you select private data when viewing the portfolio and using the models in Dashboard (eg for trades with trade date on 9 May but private data is not available), the system will use the latest date's settlement price (10 May) to perform the calculations. | |
Duration | Select the end date to determine the range of period and cut-off date for the calculations of P/L. End Date will be yesterday's date by default. End Date cannot be today's date. You are free to edit the dates as necessary. Auto-Update Tick: Resets the dates to default once you leave the ‘Dashboard’ page. Untick: Dates according to your settings remain unchanged once you leave the ‘Dashboard’ page. |
Comments | The inserted comments will be displayed at the bottom of the application. This can be useful for documentation purposes or for settings description. |
Input nd
Name | Description | Type | Example |
|---|---|---|---|
| Portfolio | Portfolio selected. | Portfolio (Selection) | ABC |
| End Date | End of product time-series. | Date (YYYY-MM-DD) | 2019-06-14 |
| Auto Update | Tick: Resets the dates to default once you leave the ‘Dashboard’ page. Untick: Dates according to your settings remain unchanged once you leave the ‘Dashboard’ page. | Checkbox | - |
| Comments | Useful for documentation purposes or for settings description. | Text | - |
Output
Description | Type | |
|---|---|---|
Product/Strategy Information | Provides an overview of all the open positions in your portfolio. You can reorganise your data by dragging-and-dropping the columns at the top of the table to 'set row groups'. | Text |
Example
Functionality
Please refer to Table Settings for table functionalities.
Definition of Terms
Please refer to List of Definitions: Trades.
Click to access:
