Table Settings
- Christabel Chiang (Unlicensed)
- IT Support
- e0031959 (Unlicensed)
- MAF Intern (Unlicensed)
In MAF Cloud, you may come across AG-Grid tables which have several functions that you can utilise.
TABLE OF CONTENTS
General
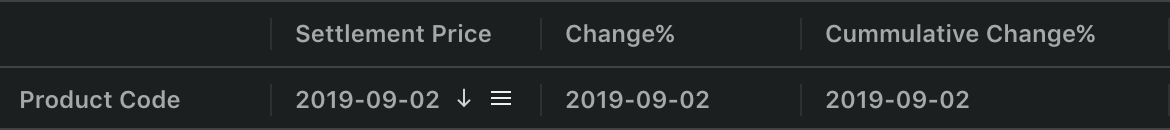
You will be able to find context menus with certain user interactions. By hovering over the cell table's header, you will be able to find a button ![]() (represented by 3 horizontal lines) that allows you to access certain functions. To save the layout, please refer to Table Layout Settings.
(represented by 3 horizontal lines) that allows you to access certain functions. To save the layout, please refer to Table Layout Settings.
| Buttons | Name | Description | Interaction |
|---|---|---|---|
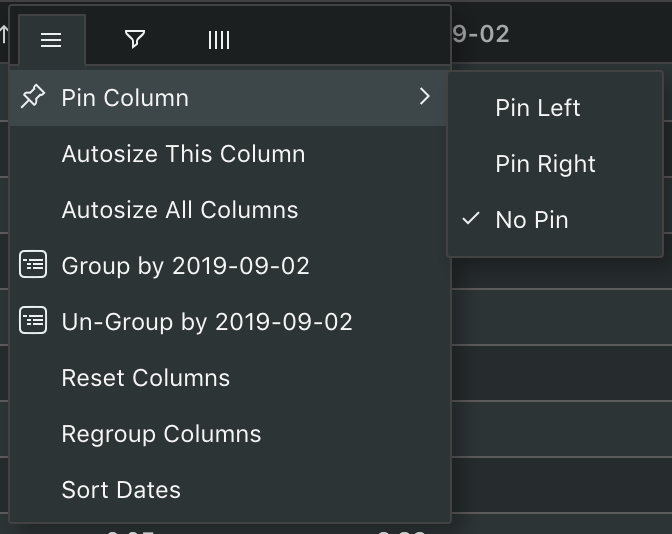
| First Button (represented by 3 horizontal lines) | Pin Column | Pin selected column to the most left or right of the table, or reset the settings by selecting 'No Pin'. |
|
| Autosize This Column | Automatically resize the selected column to fit the information in the column. | ||
| Autosize All Columns | Automatically resize all the columns in the table to fit the information in their respective columns. | ||
| Group by... | Group information by the selected column. | ||
| Un-Group by... | Un-group selected column to return to default table format. | ||
| Reset Columns | Reset columns back to default. | ||
| Regroup Columns | Regroup the column headers. | ||
| Sort Dates | Sort columns by date. | ||
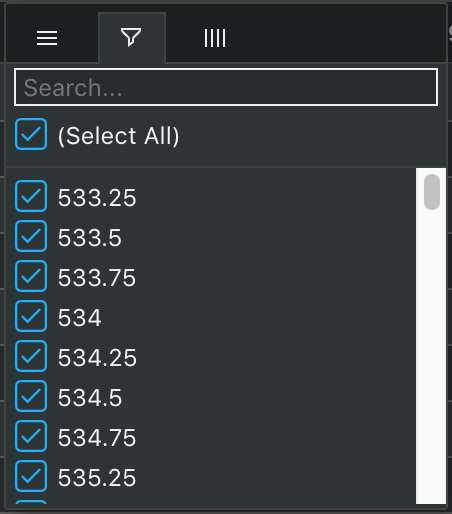
| Second Button (represented by a filter funnel icon) | Filter by Row | Filter information by rows in the selected column by ticking the checkbox to customise information based on your needs. Once you filter your data, it will remain filtered whenever you return to the page, until you right-click/click on the 'Reset Filter' button | |
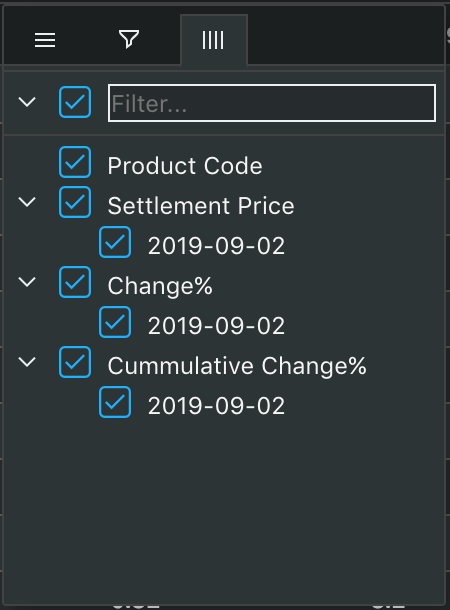
| Second Button (represented by 4 vertical lines) | Filter by Column | Filter information by columns by ticking the checkbox to customise information based on your needs. |
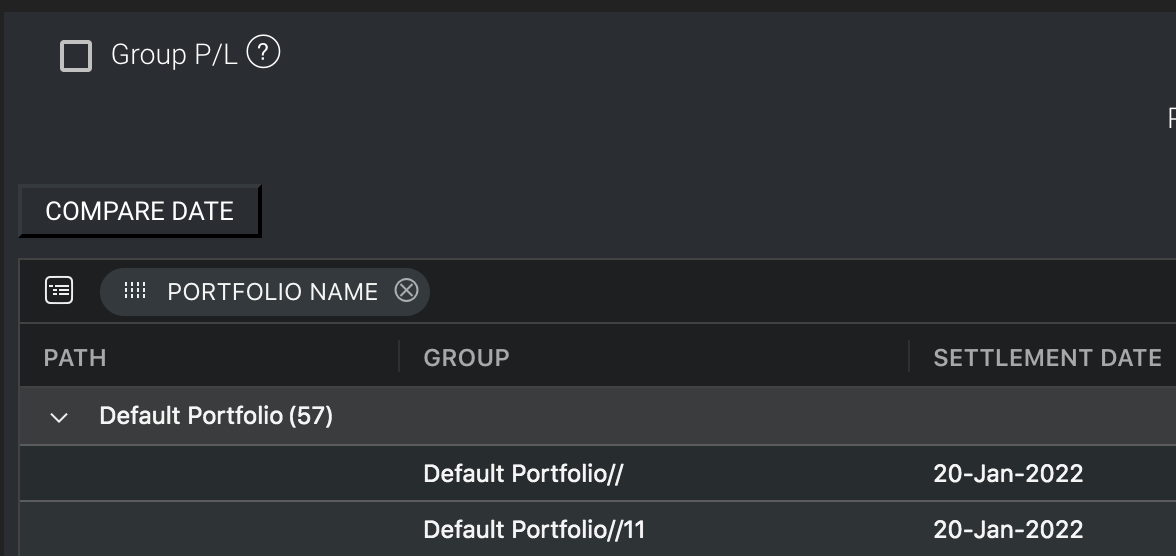
You will be able to group the rows by dragging the header names into the area (Drag here to set row groups).
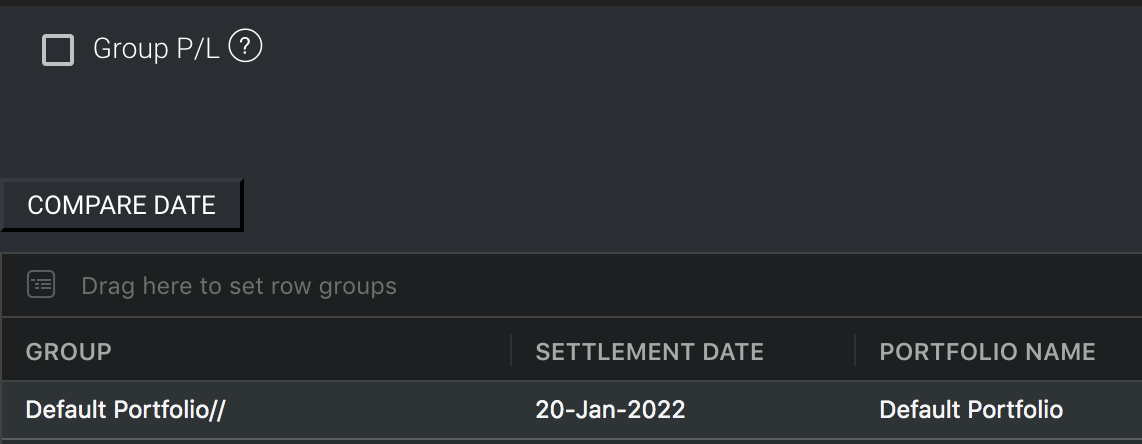
For instance, you may drag PORTFOLIO NAME into the area and the trades will be grouped and displayed accordingly. All grouped rows on different levels will be shown in a different colour.
Right-Click in Table
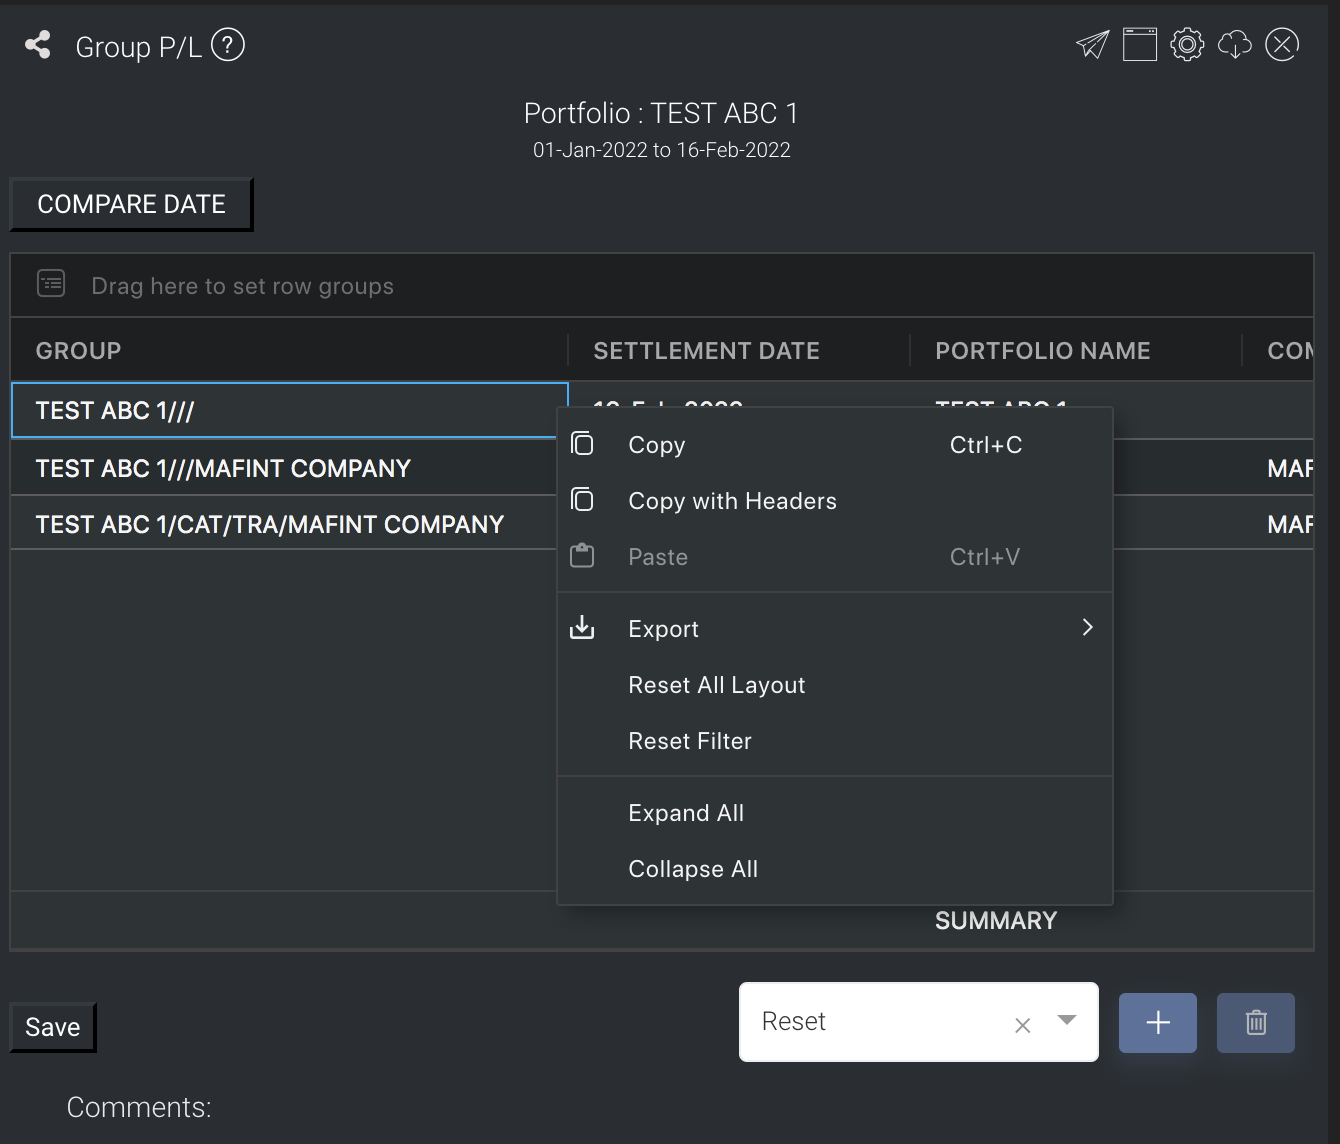
By right-clicking anywhere in the table, you will be able to access the table's context menu to export data, reset layout, reset filters and expand/collapse data rows etc.
| Name | Description |
|---|---|
| Copy | Copy information in the table cell. |
| Copy with Headers | Copy information in the table cell along with column header. |
| Export | Export the entire table's information into .CSV, .xlsx or .xml format. |
| Reset All Layout | Reset table layout to default. |
| Reset Filter | Reset all of the table's filters. |
| Expand All | Expand all grouped rows. |
| Collapse All | Collapse all grouped rows. |
Date Filters
Date filters are available for any columns with dates (eg. 'CP/BL Date', 'Timebar Ref Date', 'Notification Timebar Date', 'Full Claim Timebar Date', 'Claim Date', 'Value Date', 'Last Updated' in 'Demurrage Claims Table' table).
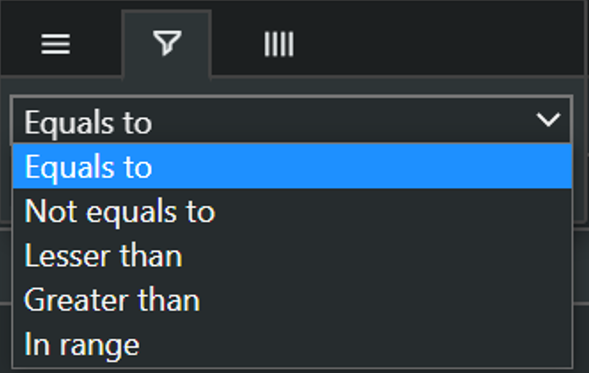
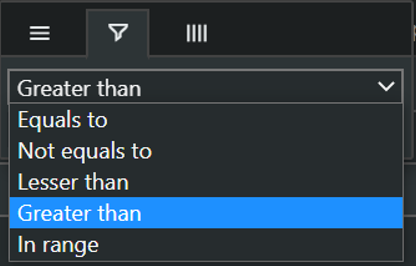
There are 5 filters available:
- "Equals to": Table will filter and display all the dates which are equal to the date you input
- "Not equals to": Table will filter and display all the dates which are not equal to the date you input
- "Lesser than": Table will filter and display all the dates which are earlier (lesser) than the date you input
- "Greater than": Table will filter and display all the dates which are later (greater) than the date you input
- "In range": Table will filter and display all the dates which are in the range of the 2 dates that you input. For example, if the 2 dates you input are "1 Jan 2020" and "10 Jan 2020", they will not be displayed (are not inclusive) and the table will only filter and display dates between "1 Jan 2020" and "10 Jan 2020", and exclude "1 Jan 2020" and "10 Jan 2020".
For example, select the "Greater than" filter if you want to filter and display dates that are later (greater) than the date that you want to input.
Click "dd" and input the date (eg "01/02/2020").
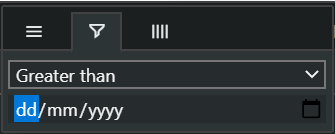
The table will automatically filter and display cells that are later (greater) than "01/02/2020".
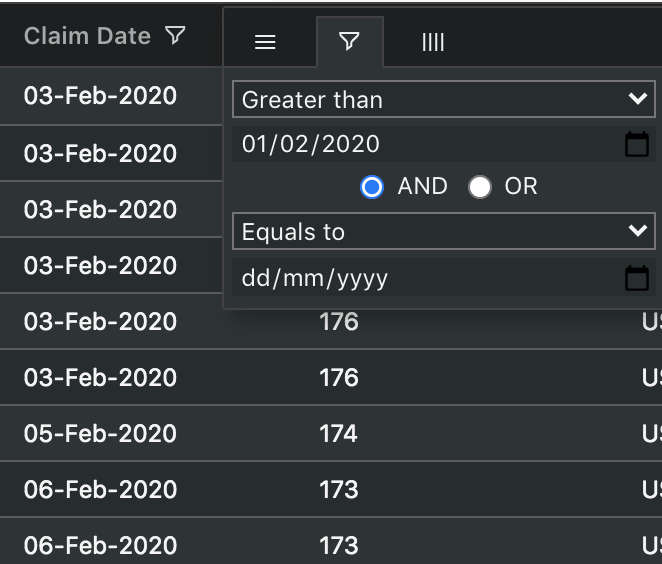
Option Buttons - "AND" and "OR"
You will see option buttons for "AND" and "OR" which are optional. You may select from the option buttons if you want additional conditions to further filter your dates. Otherwise, you may ignore it.
If you choose to use the option buttons, they will be on a conditional basis. The second condition (second filter) will only be applied if it does not clash with the first condition.
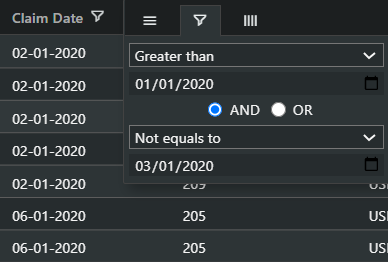
For example, if the first condition (filter 1) is "Greater than 01/01/2020", and the second condition (filter 2) is "Not equals to 03/01/2020", both filters can be applied as they do not clash with each other.
a. If the "AND" option was chosen, both conditions will be fulfilled which means that the dates filtered and displayed are both "Greater than 01/01/2020" AND "Not equals to 03/01/2020".
b. If the "OR" option was chosen, either one of the conditions will be fulfilled which means that the dates filtered are independent and can be either "Greater than 01/01/2020" OR "Not equals to 03/01/2020". Hence, dates that are"Greater than 01/01/2020" and "Not equals to 03/01/2020" are filtered and displayed in the table.
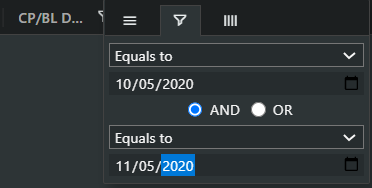
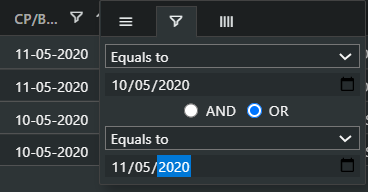
However, for example, if the first condition (filter 1) is "Equals to 10/05/2020" and the second condition (filter 2) is "Equals to 11/05/2020", the conditions clash with each other.
a. If the "AND" option was chosen, the table will not show any date, as it is impossible for the date in a cell to be both "10/05/2020" and "11/05/2020".
b. If the "OR" option was chosen, it means either filter 1 OR filter 2 will be applied to the table. Hence, both "10/05/2020" and "11/05/2020" are filtered and displayed in the table.
Examples of "AND" Option Button
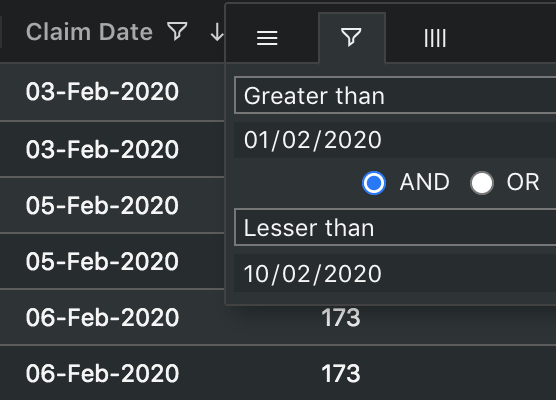
For example, you select "Greater than" and key in a date (eg "01/02/2020"). You then select "AND" and "Lesser than" and key in the date (eg "10/02/2020").
The table will automatically filter and display cells that are both later (greater) than "01/02/2020" and lesser than "10/02/2020".
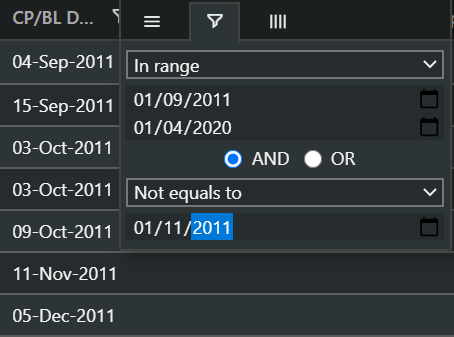
Another example is you select "In range" and key in the dates (eg "01/09/2011" and "01/04/2020"). You then select "AND" and "Not equals to" and key in the date (eg "01/11/2011").
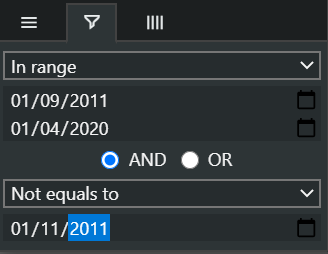
The table will automatically filter and display cells that are from "01/09/2011" (not inclusive) to "01/04/2020" (not inclusive) and exclude "01/11/2011".
Examples of "OR" Option button
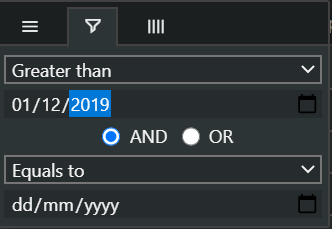
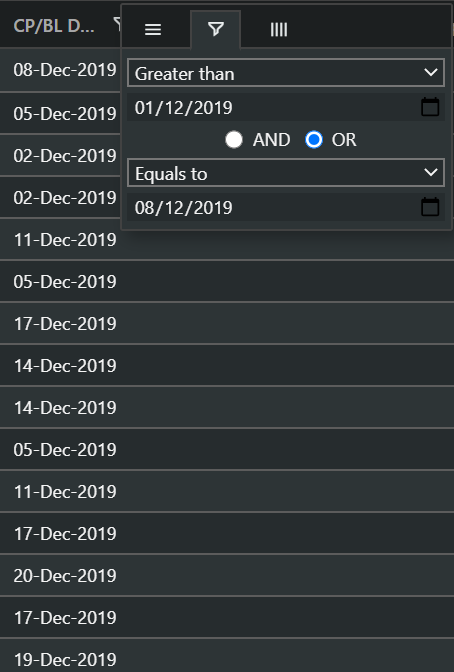
For example, you select "Greater than" and key in a date (eg "01/12/2019"). You then select 'OR' and 'Equals to" and key in the date (eg "08/12/2019").
The table will automatically filter and display cells that are either later (greater) than "01/12/2019" or equal to "08/12/2019".
Pivot Table
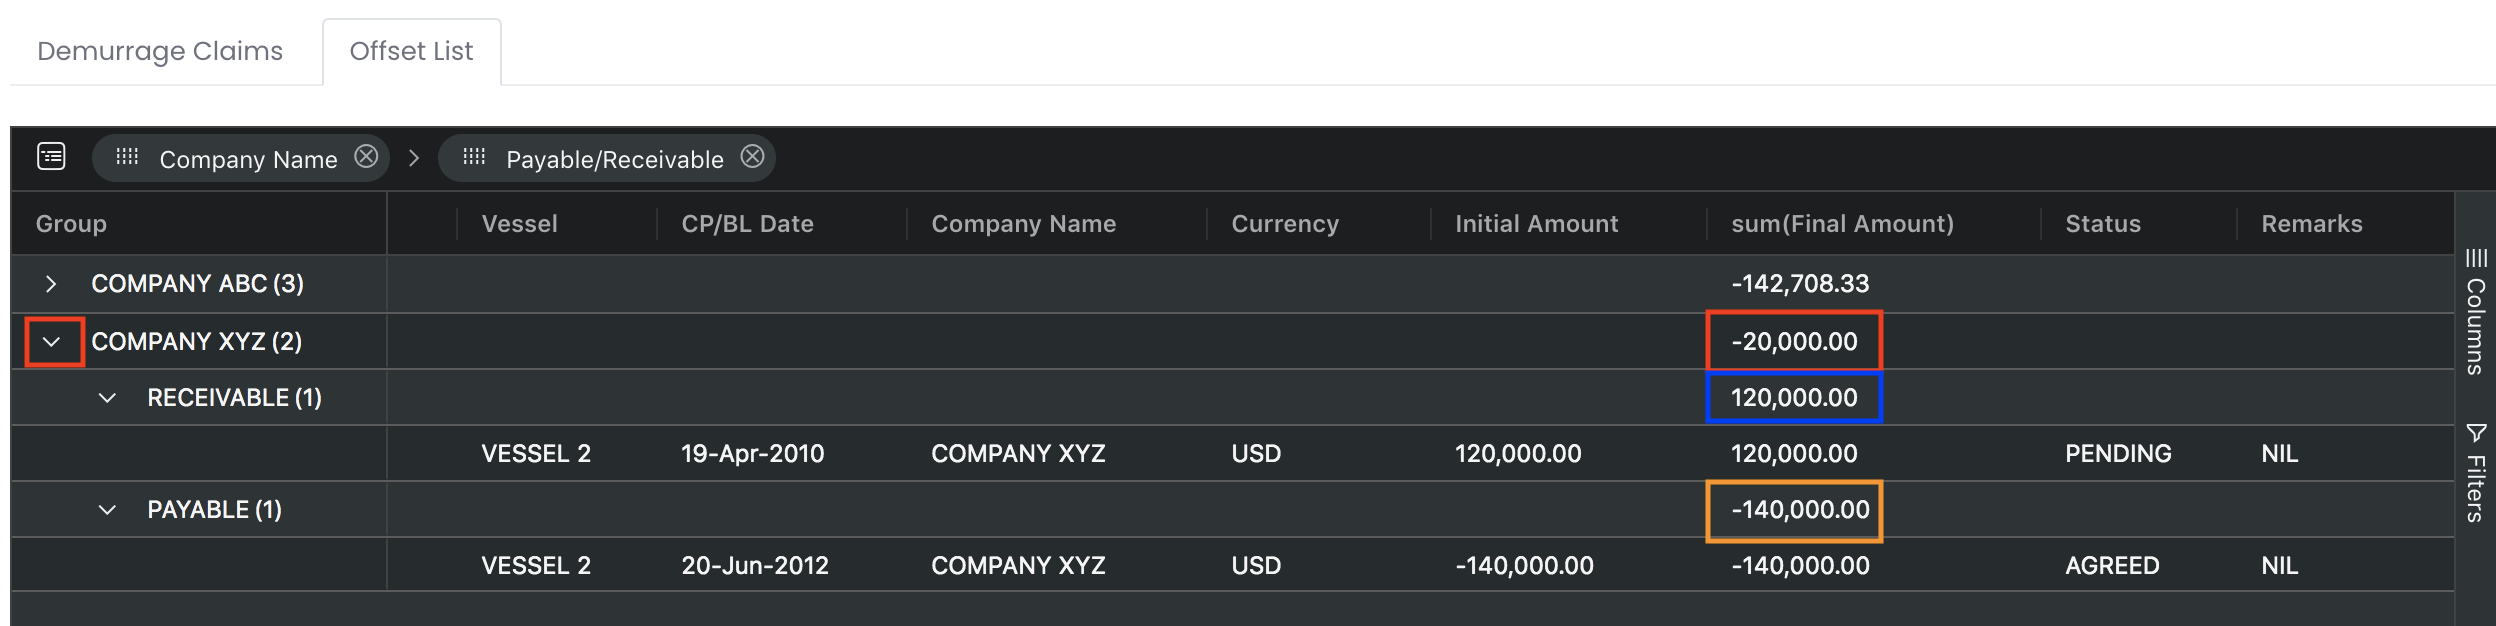
1. The Demurrage Claims Offset List table is an example of a pivot table used in MAF Cloud. The main data automatically filtered here are 'Company Name', 'Payable/Receivable' and 'Final Amount'.
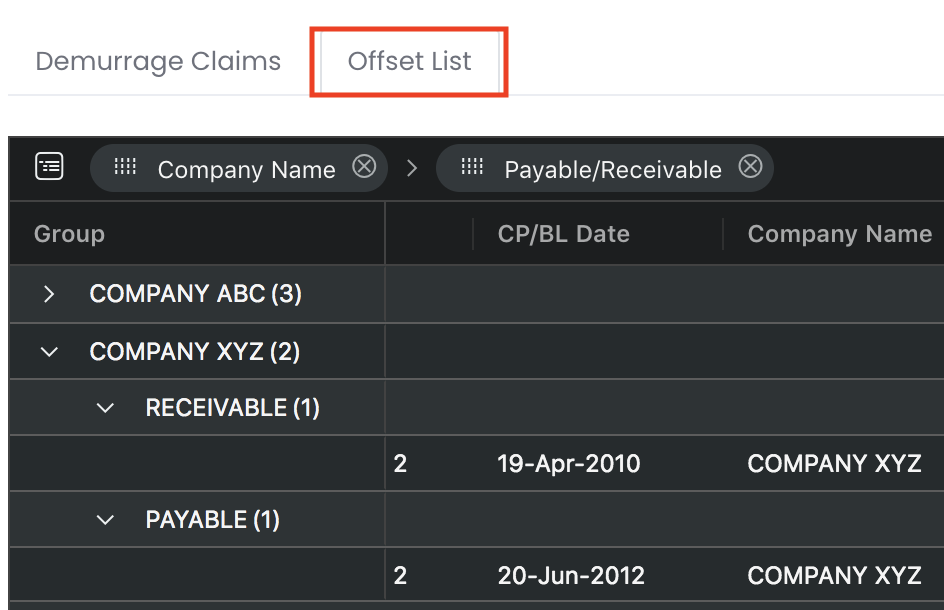
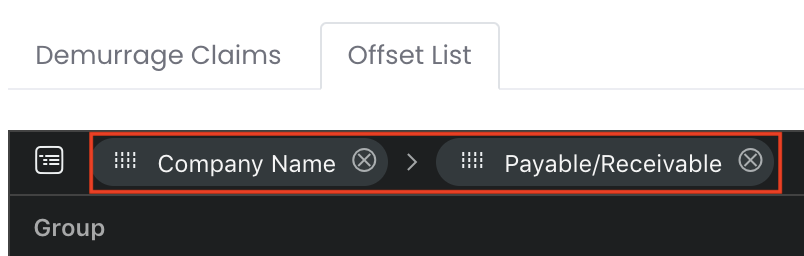
2. The 'Company Name' and 'Payable/Receivable' columns are dragged-and-dropped onto the top of the pivot table, indicating that the table will be grouped by rows according to these column headers (displayed on the left in the table). You are free to drag-and-drop or close (click on the 'X' icon) any column headers at the top of the table to organise the table according to your needs.
3. Click on the arrow next to the 'Company Name' (under 'Group') to display the data (individual, summary or aggregated) according to the setting. In this example, we will be able to view the initial and final payable and receivable amounts between the relevant parties and offset amount here. We can see that Company XYZ has a final receivable amount of USD120,000 and final payable amount of USD140,000. These amounts will be aggregated and displayed as USD20,000 at the top row (summary) of Company XYZ. With this function, you do not need to process any data and can view all your outstanding claims at a glance!
Click to access: