Daily Pricing Position Change Model
- MAF Intern (Unlicensed)
- IT Support
Return to Overview
About
The Daily Pricing Position Change model calculates the changes in the position(s) in a portfolio, due to daily pricing, for that day. A certain number of positions in the user’s portfolio will be priced by Platts each day, hence fixing their prices (and the position is changed from "open" to "closed"). This model allows users to easily track which position(s), and how much of them, have their price(s) fixed for each trading day.
Daily Position Change = Total Position Size (for a given month) / Number of trading days in that month
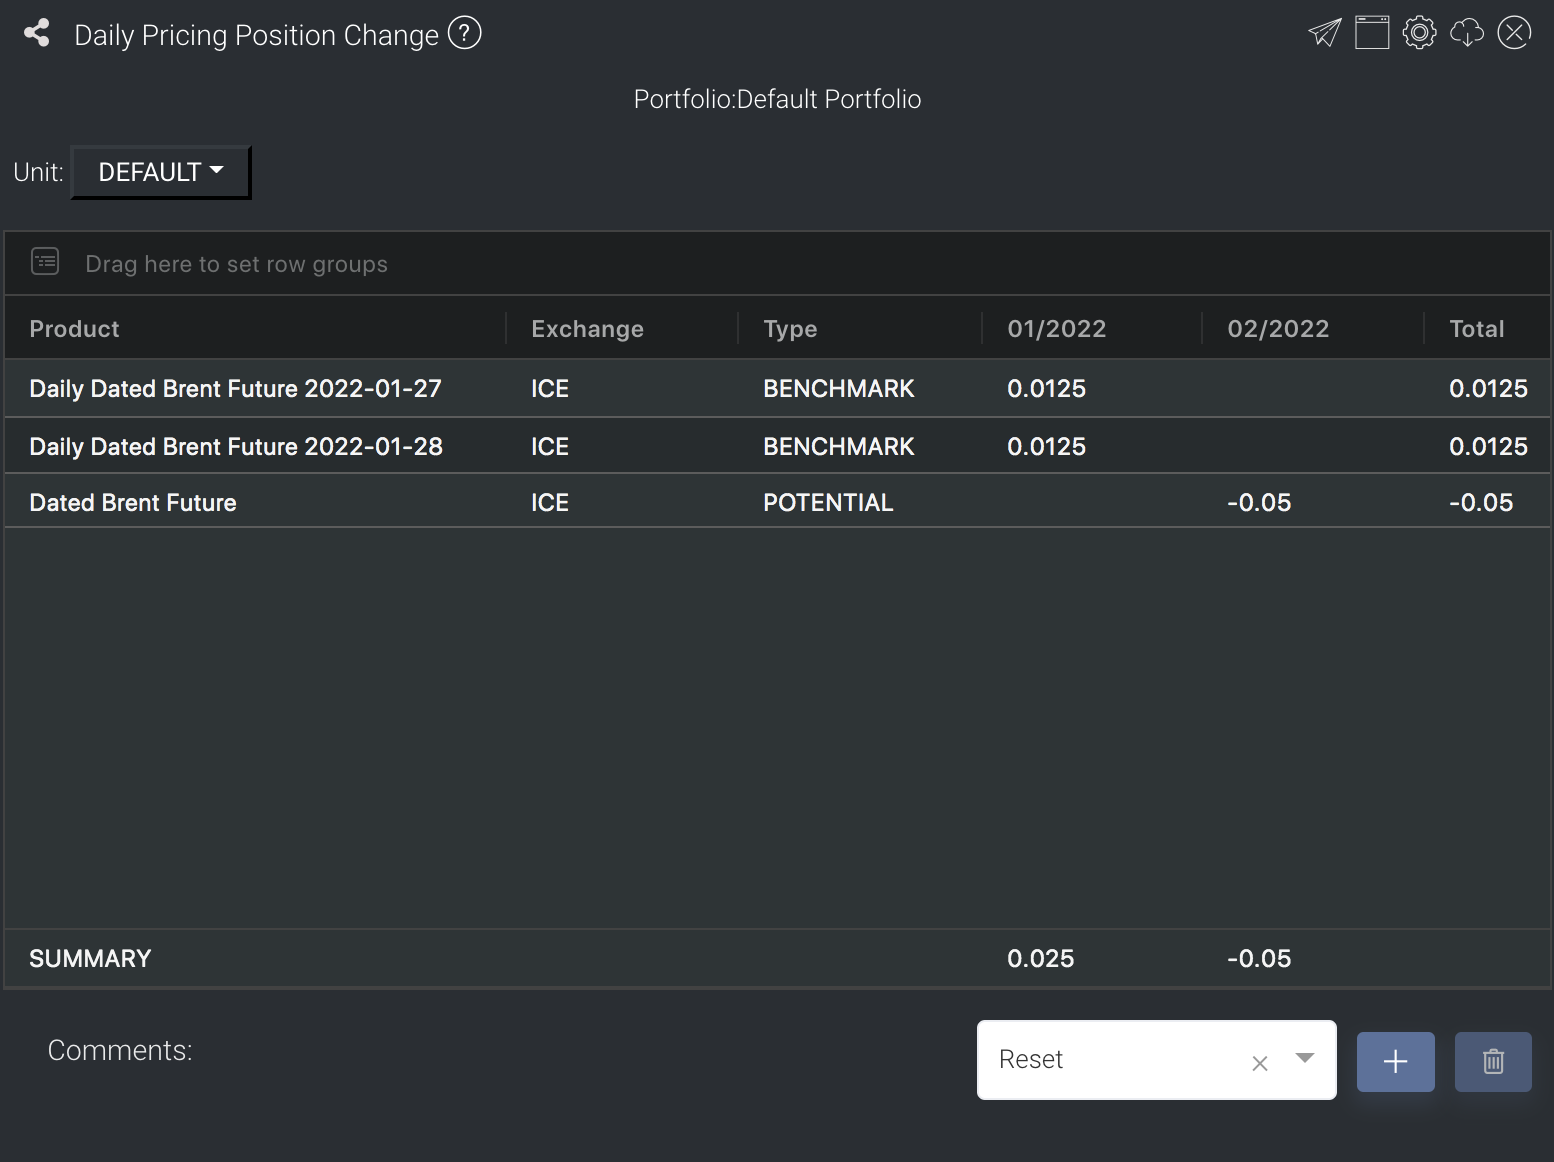
The rows are the various products in the portfolio, while the columns indicate product information (such as exchange, product type, contract type), the change in position(s) for each maturity time of the product, as well as total change in position. In this model, the user can also create customised 'strategies', such as spread positions of futures with different maturities. The user can choose if the effect of the additional strategies are shown (see: Creating a Strategy Product).
(This model follows the pricing holiday schedule of Platts for various markets worldwide, which you may find out here. Also see Futures Contracts Codes for more information on exchange and month codes, if required.)
Navigation
To access the quantitative model/report, click on 'Dashboard' from the navigation sidebar on the left.
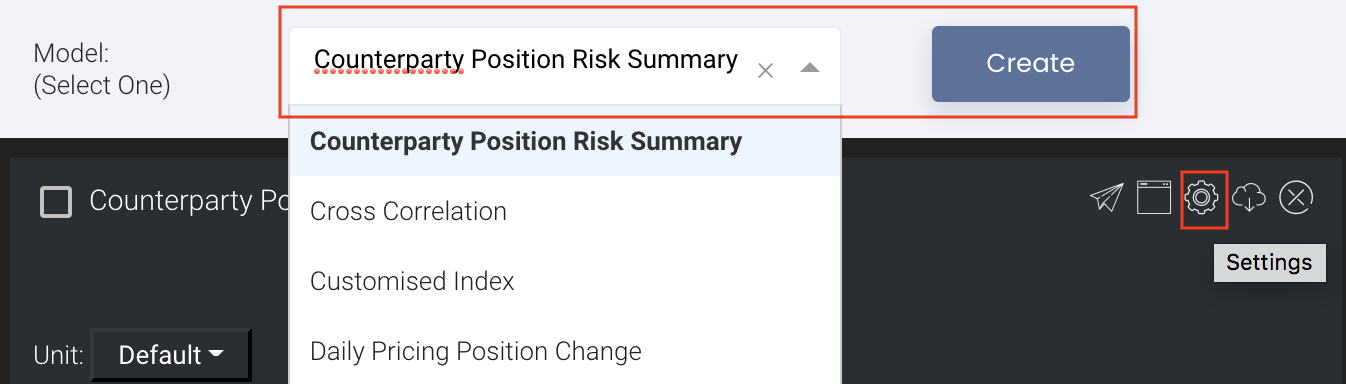
Select the model/report from the drop-down list and click 'Create'. Click on the 'Settings' button (gear icon) at the top right corner of the model to set up your model/report.
Sharing Model/Report/Dashboard
To share the model with your group members, click on the "Share" button next to the Title of the model followed by the email address of the group members you want to share it with. Once submitted, the model will appear in the Dashboard>Group Dashboard of the selected group members.
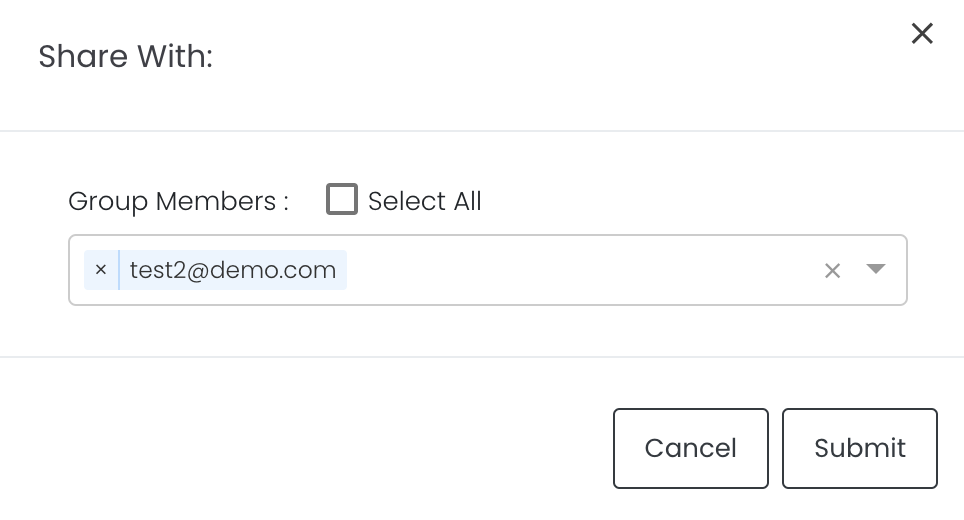
This is different from sharing individual or entire Dashboard models/reports, which allows any user who may or may not be users of MAF Cloud to access the individual model/entire dashboard via the shared web link (link will expire in 8 hours). In Group Dashboard, only group members can access the shared models/reports.
Group Rows
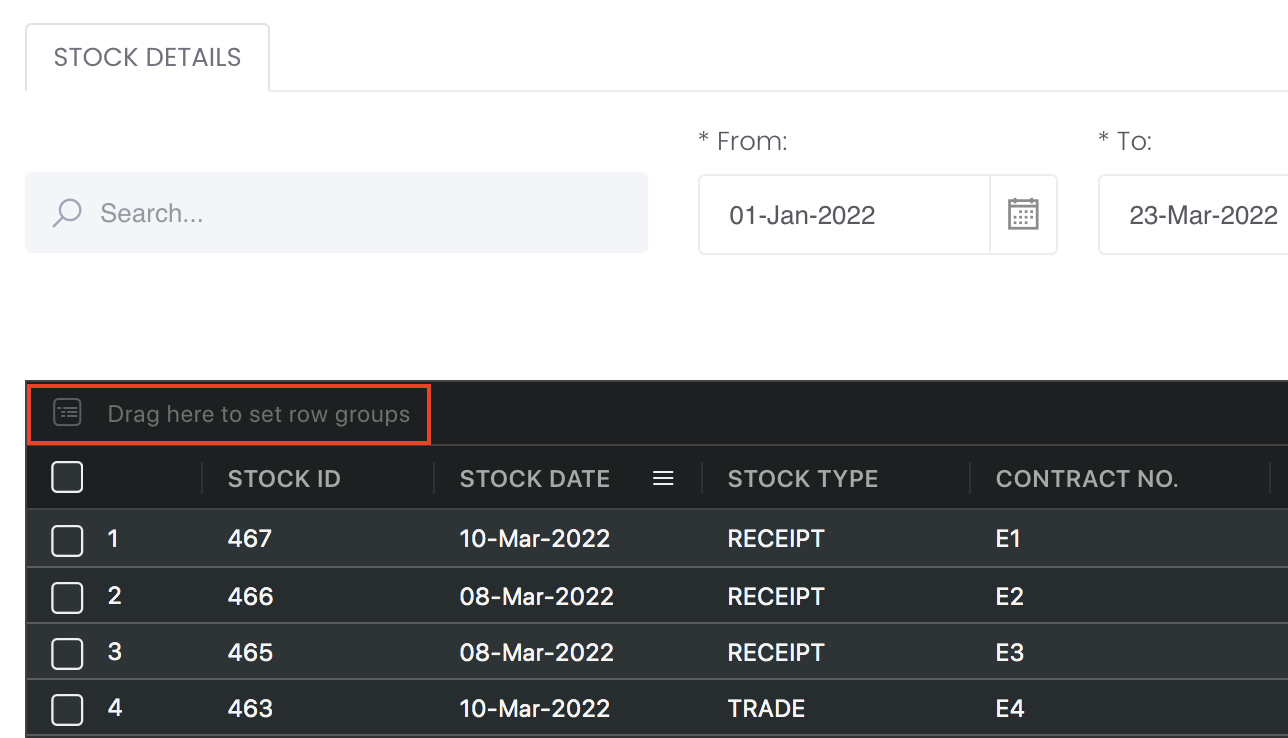
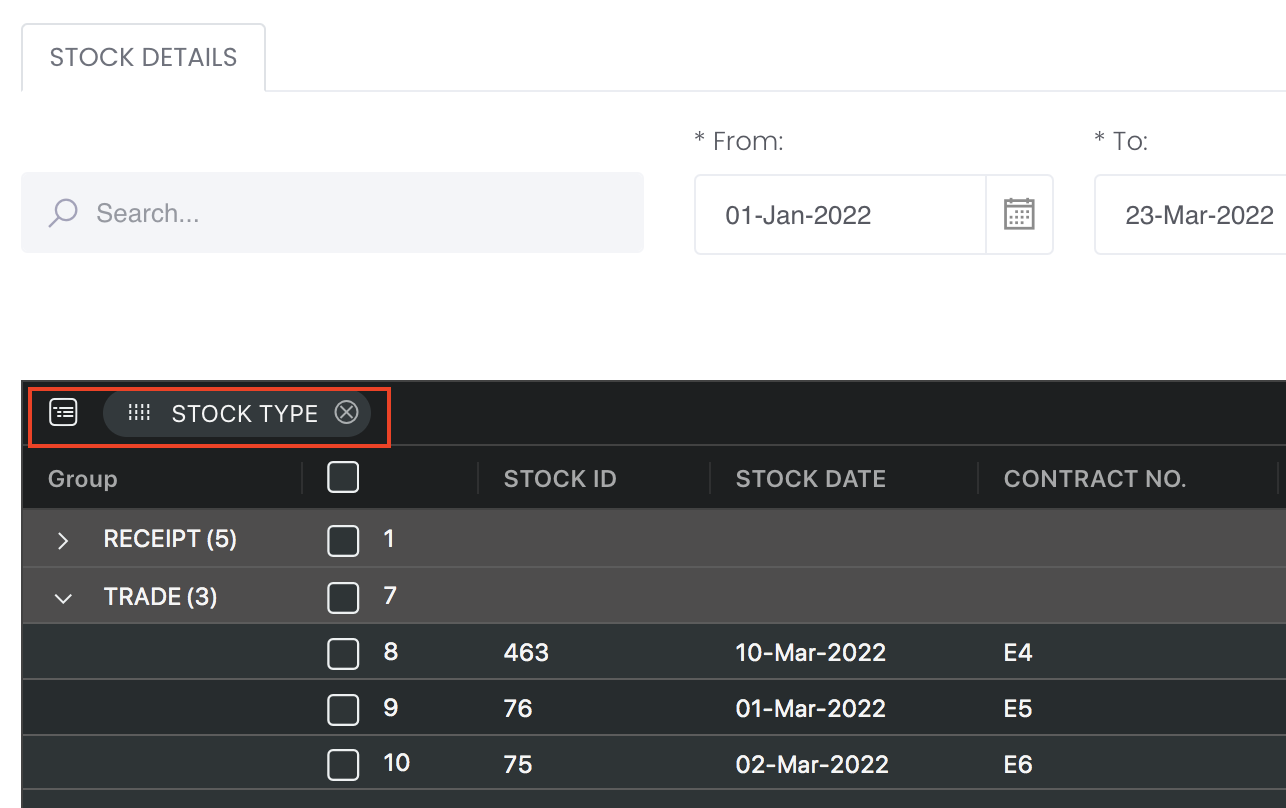
You may also group the rows (liken to the pivot table function in Microsoft Excel) to view the grouped data by dragging any column headers into the “row groups” section as highlighted:
Guide
Name | Images/Description |
|---|---|
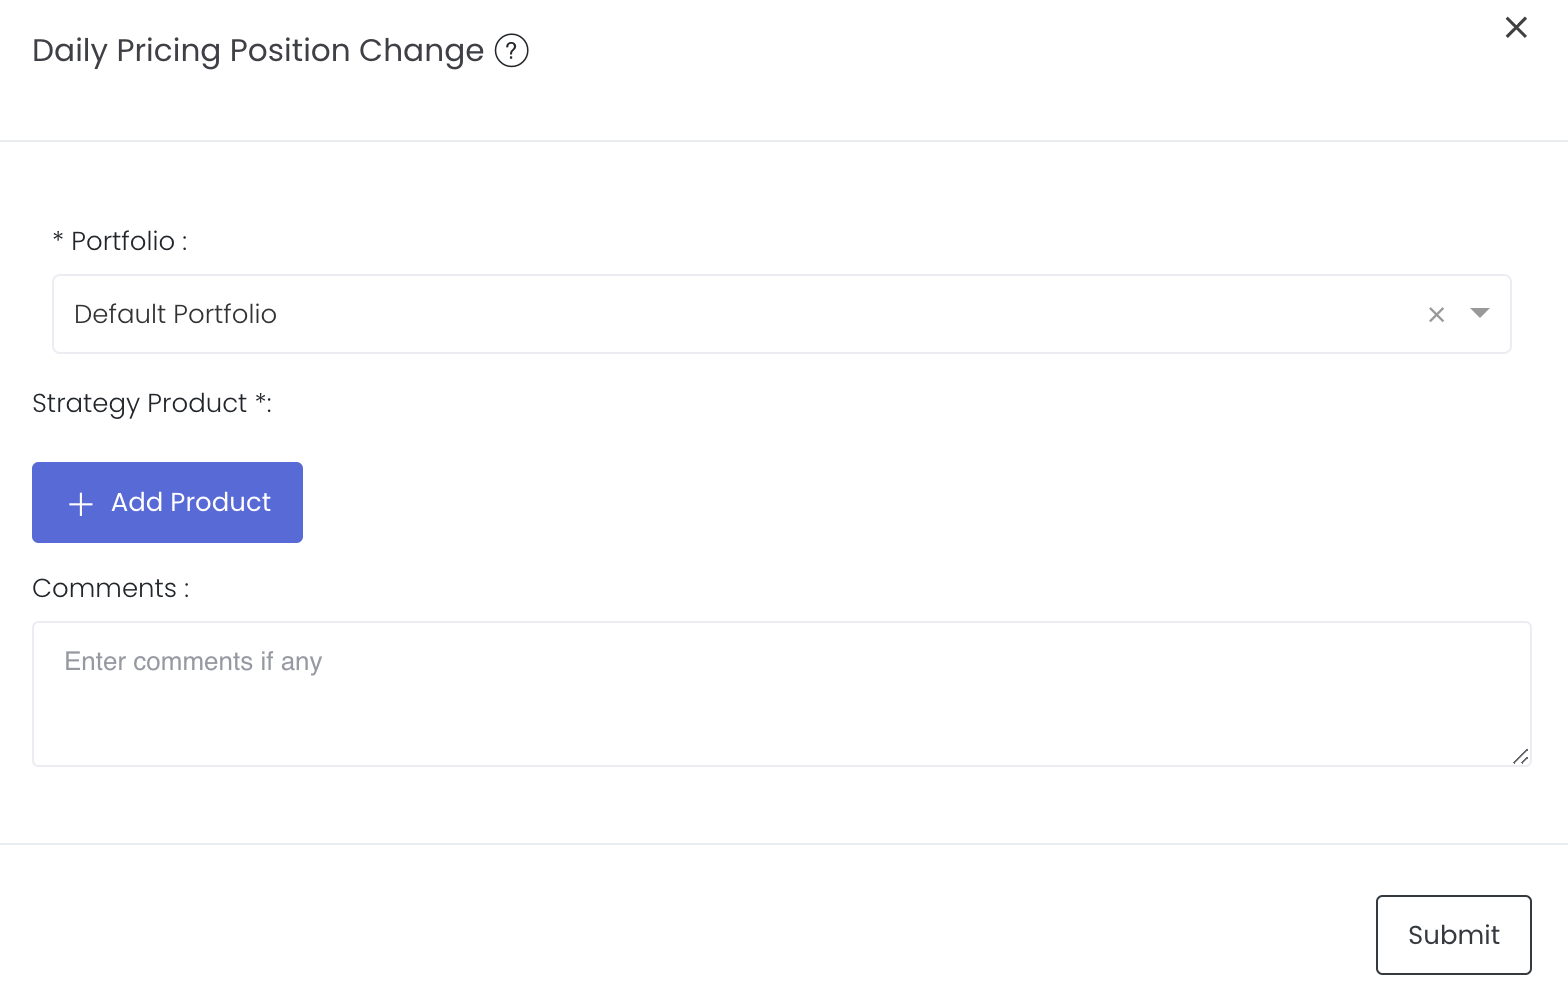
Portfolio | 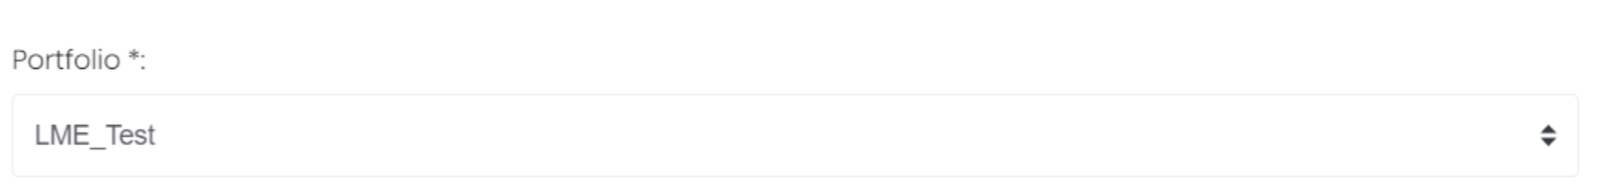 Select a portfolio of interest. |
Strategy Product |
Add Product: Select the strategy product(s) to be included when displaying the model, if any (e.g. calendar spread, inter-commodity spread, etc). The single contract positions (of all relevant contracts) will then be combined into the strategies' net positions (Meanwhile, an equivalent amount of the original positions will be deducted). Please refer to Creating a Strategy Product for an example of creating a strategy product, and the effect of adding it. |
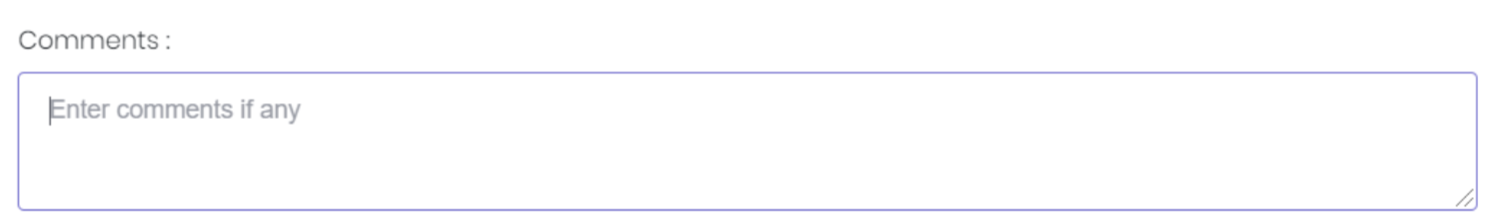
Comments |
The inserted comments will be displayed at the bottom of the application. This can be useful for documentation purposes or for settings description. |

Input
Description | Type | Example | |
|---|---|---|---|
Portfolio | Portfolio to be analysed | Portfolio (Selection) | Sample portfolio #1 |
Strategy Product(s) | Strategy product(s) to be included | Product | Sugar |
Comments | Any comments | Text | - |
Output
Description | Type | |
|---|---|---|
Product/Strategy Information | The details of product(s) are indicated in the first 3 columns: product name, exchange it is traded in, and product type. For strategy product(s), these were manually filled in by the user when creating the strategy. | Text |
Position Change(s) | The remaining columns display the changes in the product's position(s) in the portfolio. Each column shows the change for a particular Contract Year/Month (arranged in chronological order), and the last column sums up the total change for that product. | Number |
Example
Functionality
Unit Selection: Users may choose the units (default, lots, barrels etc.) in which the position sizes are to be displayed.
Please refer to Table Settings for table functionalities.
Click to access: