Guide to Dashboard
- IT Support
- e0031959 (Unlicensed)
- Christabel Chiang (Unlicensed)
Return to Overview
About
The 'Dashboard' is a platform that allows users to create and display a variety of customisable quantitative models using tools available in MAF Cloud – this includes various graphs and tables that the user may find useful when performing quantitative analysis on financial products, or managing his/her portfolio (see 'Model Guides' below for more information about the models provided by MAF Cloud, and how to use them).
The user can create multiple windows containing the different models in the 'Dashboard', and edit, move, resize or delete them as desired.
Accessing your 'Dashboard'
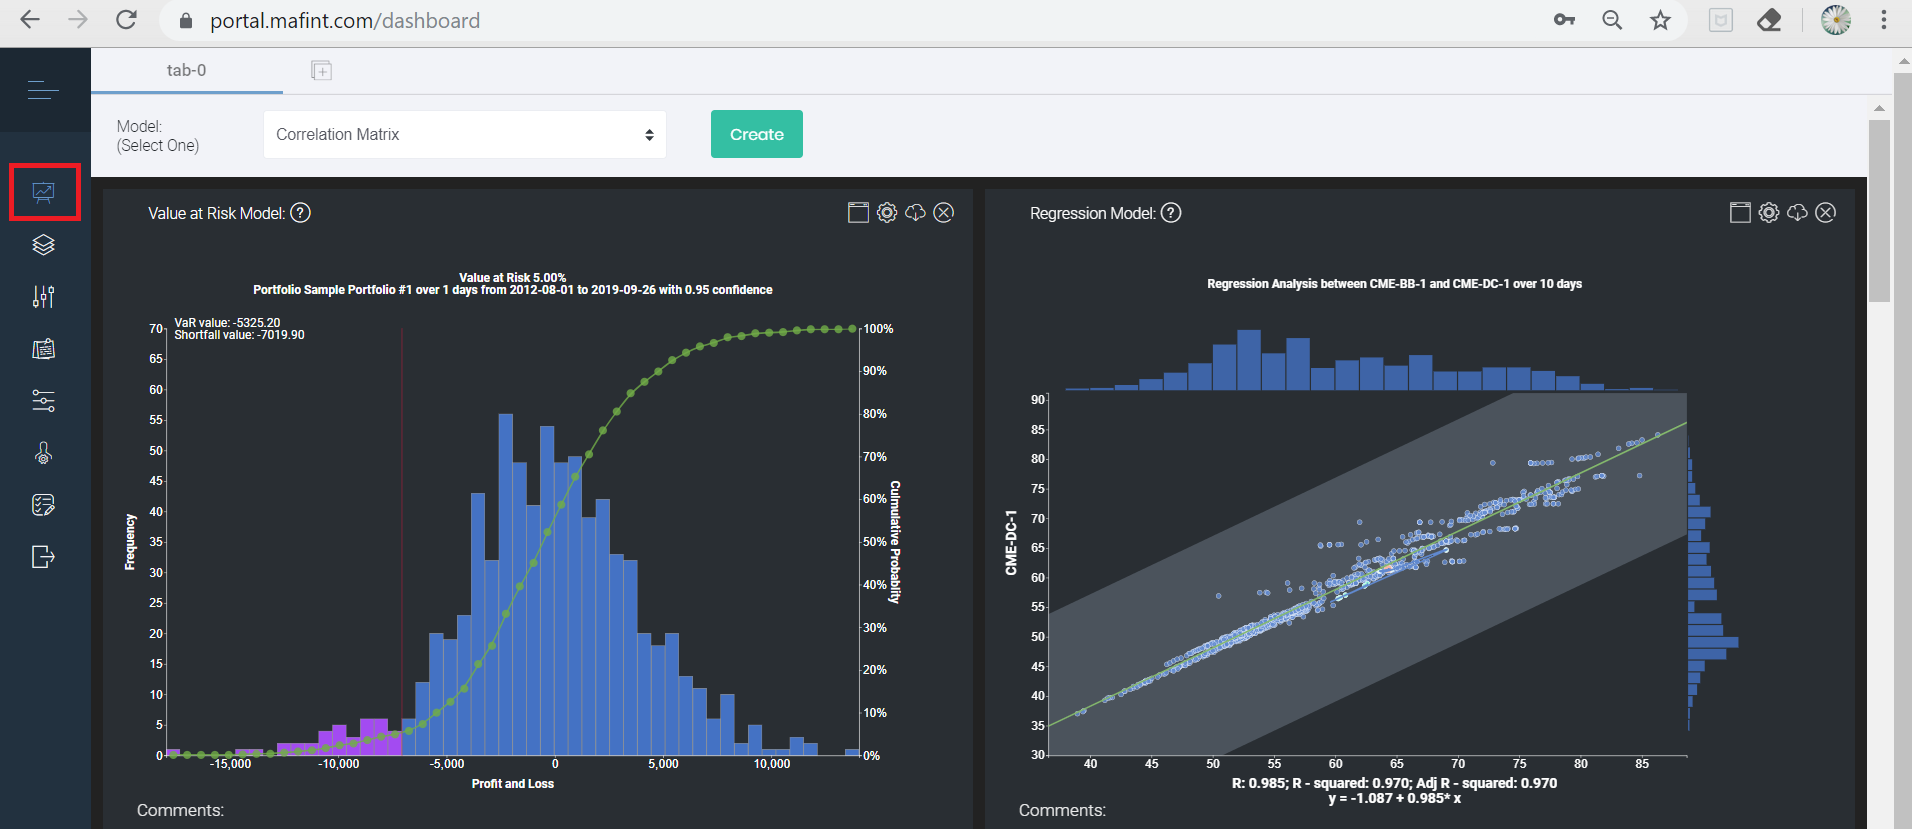
You can access your 'Dashboard' by clicking on the second button (represented by a 'chart board' icon) from the navigation bar on the left.
Functionality
Creating a new model
You can create a new model by selecting your desired model from the drop-down list, and clicking on 'Create'. Please note that the "Create Model with Full Width" is ticked by default to allow you to create a model with full width window. If you prefer half width window, please untick the check box.

The window containing the model is blank when first created. All newly created models will appear at the top of the page The details must first be entered by the user in 'Settings' before the output can be generated.
Window Functions
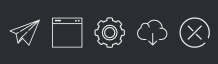 At the upper-right corner of each window are five clickable icons. Their functions are described as follows:
![]() Copy to Clipboard: Click to generate a weblink (that will be copied to your device's clipboard) to share the individual model with anyone; the link will expire in 8 hours. Anyone with the link will be able to view the individual model ONLY, and have no access to any details in your account. You may also share the entire Dashboard instead, please refer to "Share Dashboard" at the bottom of this page.
Copy to Clipboard: Click to generate a weblink (that will be copied to your device's clipboard) to share the individual model with anyone; the link will expire in 8 hours. Anyone with the link will be able to view the individual model ONLY, and have no access to any details in your account. You may also share the entire Dashboard instead, please refer to "Share Dashboard" at the bottom of this page.
![]() Expand: Open the window as a larger, dedicated window.
Expand: Open the window as a larger, dedicated window.
![]() Settings: Input and edit details about the product(s) or portfolio for which you wish to generate the model for.
Settings: Input and edit details about the product(s) or portfolio for which you wish to generate the model for.
![]() Export: Download the model you created (as either .csv or image file) into your device.
Export: Download the model you created (as either .csv or image file) into your device.
![]() Delete: Remove the window from your 'Dashboard'.
Delete: Remove the window from your 'Dashboard'.
![]() Window edges: You can resize the window containing the model by dragging one of its corners.
Window edges: You can resize the window containing the model by dragging one of its corners.
 Help tooltip: Mouse over the 'question mark (?)' icon for a short description of the selected model. You can also click on the icon to open a new window containing a more comprehensive user guide for the particular model.
Spinning: This chart is in the 'Featured Charts' page.
Static: This chart is not in the 'Featured Charts' page.
Tabs (Not Available Now)
You can create new tabs at the top of the 'Dashboard'. This will allow you to easily track and manage multiple models for multiple portfolios. The settings and general layout for each tab can be customised according to your preference.
Click on the 'add' button (represented by a '+' sign) to create a new tab. On each existing tab, you can either edit (represented by a 'pencil' icon) the tab's name or delete (represented by a 'X' sign) the tab.

Settings
Details for generating the model are keyed in by the user under 'Settings' (represented by a 'gear' icon). After all the required fields are filled, click on the 'submit' button to load the model. You will still be able to edit the details by clicking on the 'Settings' button. Click on the 'submit' button after making the changes to update the model. The model will then reload to reflect the changes.
Cursor Functionalities
Users can zoom in and out of some of the graphs to view them over a longer or shorter time-period (lower or higher resolution), by scrolling in the graph. Mouse users can use the scroll wheel, while touchpad users can slide 2 fingers either upwards or apart (depending on your computer). This function is applicable to most time-series based models, such as Customised Index and Forward Curve models.
Users can also scroll to the left or right in the graphs by dragging their cursor (applicable to most time-series-based models).
Sharing with Group Members
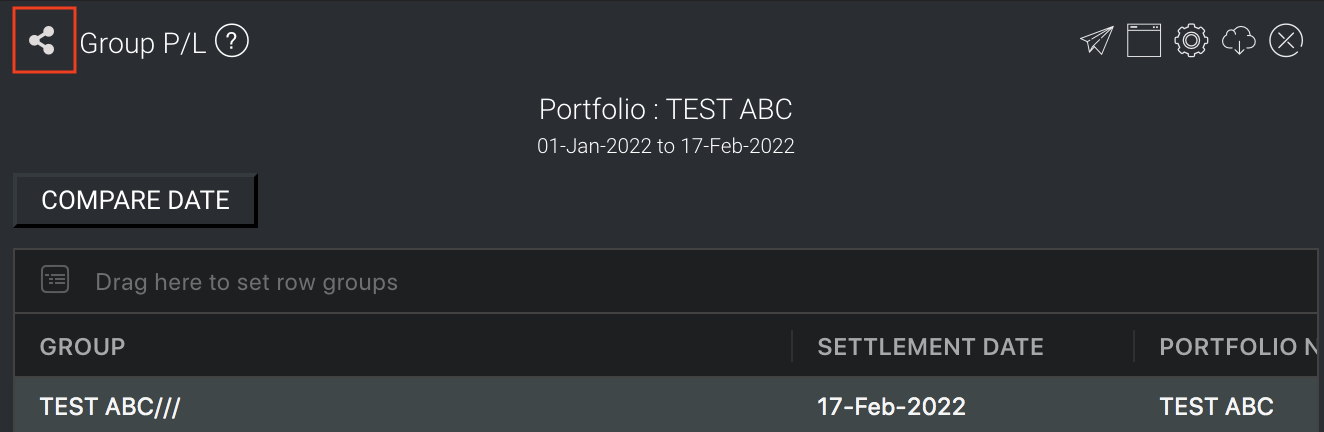
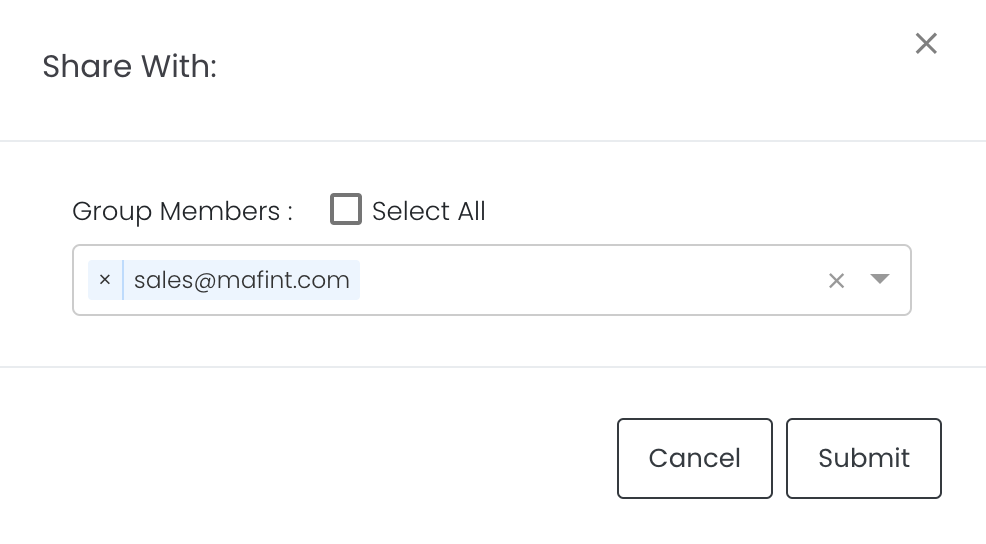
To share the models with your group members, click on the "Share" icon next to the title of the model and choose the members (as well as yourself) to share with. The models will be automatically displayed in the Dashboard > Group dashboard for your group members to access. Please click here: Individual & Group Dashboard to learn more.
Share Dashboard
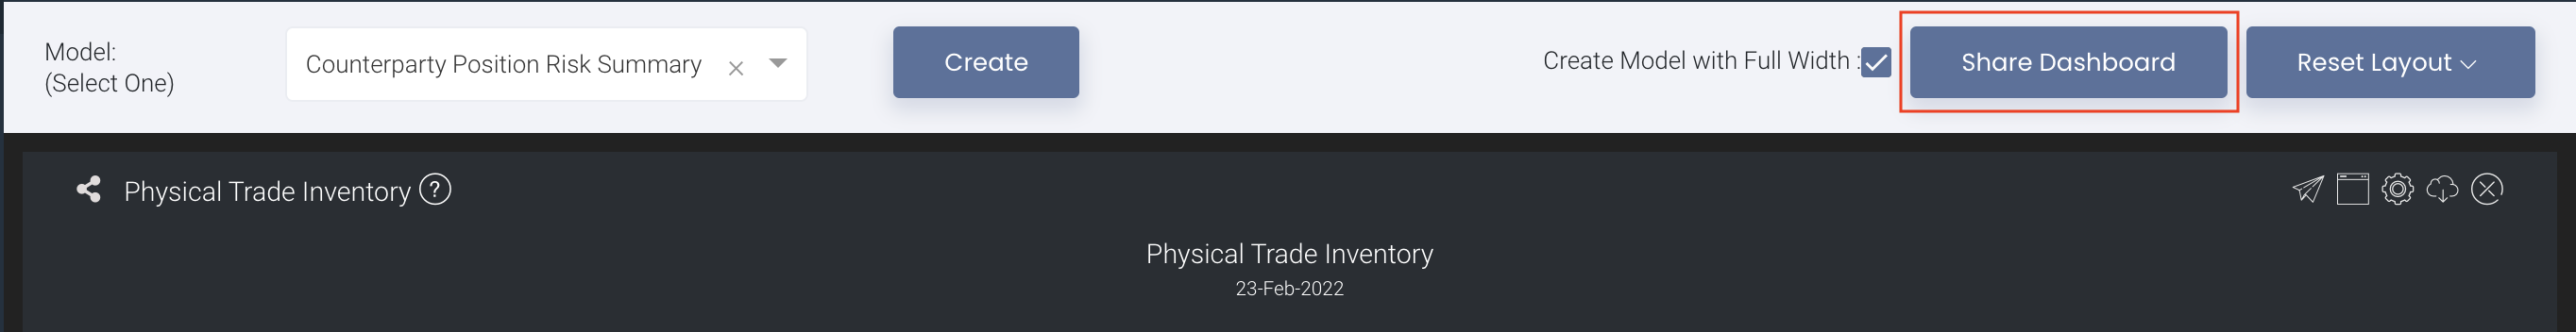
Click on "Share Dashboard" to generate a weblink (that will be copied to your device's clipboard) to share the entire Dashboard of models with anyone; the link will expire in 8 hours. Anyone with the link will be able to view the models ONLY, and have no access to any details in your account.
Reset Layout
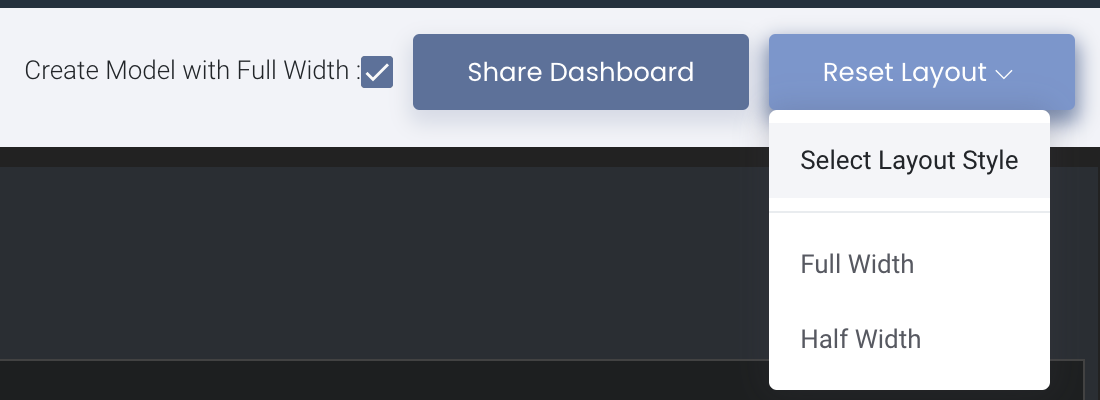
After you delete certain models and do not want to rearrange the models manually, you may use the "Reset Layout" function to auto reset the windows of each model. You may reset the Dashboard's layout by clicking on "Reset Layout", and select "Full Width" or Half Width" to reset all models in the dashboard to the select width.
Model Guides
For more information on how to use each model, click on the selected model's link below. Alternatively, you can click on the 'question mark' icon located next to the title of each model (see above: 'Help tooltip' under 'Window functions').
- Counterparty Position Risk Summary
- Cross-Correlation Model
- Customised Index Model
- Daily Pricing Position Change Model
- Exotic Account Details
- Exotic Position Details
- Forward Curve Model
- Forward Curve Table
- Futures Account
- Fund NAV Report
- FX Exposure Report
- Daily Statement
- Group P/L
- Group P/L Chart
- Hedge Ratio
- Historical Group P/L
- Inventory Stock Type Details
- Inventory Summary
- Open Position Details
- Outstanding Physical Trade Deals Matrix
- Physical Trade Inventory
- Physical Trade Status
- Portfolio Allocation Model
- Portfolio Performance Chart
- Portfolio Grid
- Portfolio P/L Details
- Portfolio Return (%) Table
- Portfolio Total P/L by Instrument Contract
- Position Matrix
- Regression Model
- Spread Analysis Model
- Time Series Model
- U.S. Recession Prediction Model
- Value at Risk (VaR) Model
- Portfolio Top View Model
Click to access: