Exotic Position Details
- IT Support
Return to Overview
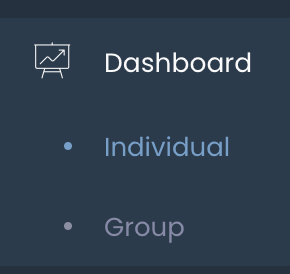
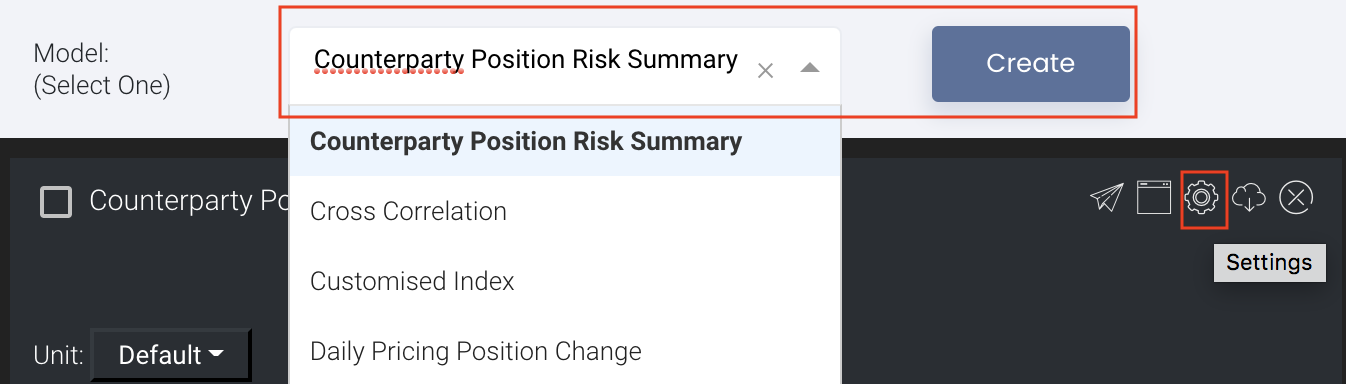
To access the quantitative model/report, click on 'Dashboard' from the navigation sidebar on the left. Select the model/report from the drop-down list and click 'Create'. Click on the 'Settings' button (gear icon) at the top right corner of the model to set up your model/report.
About
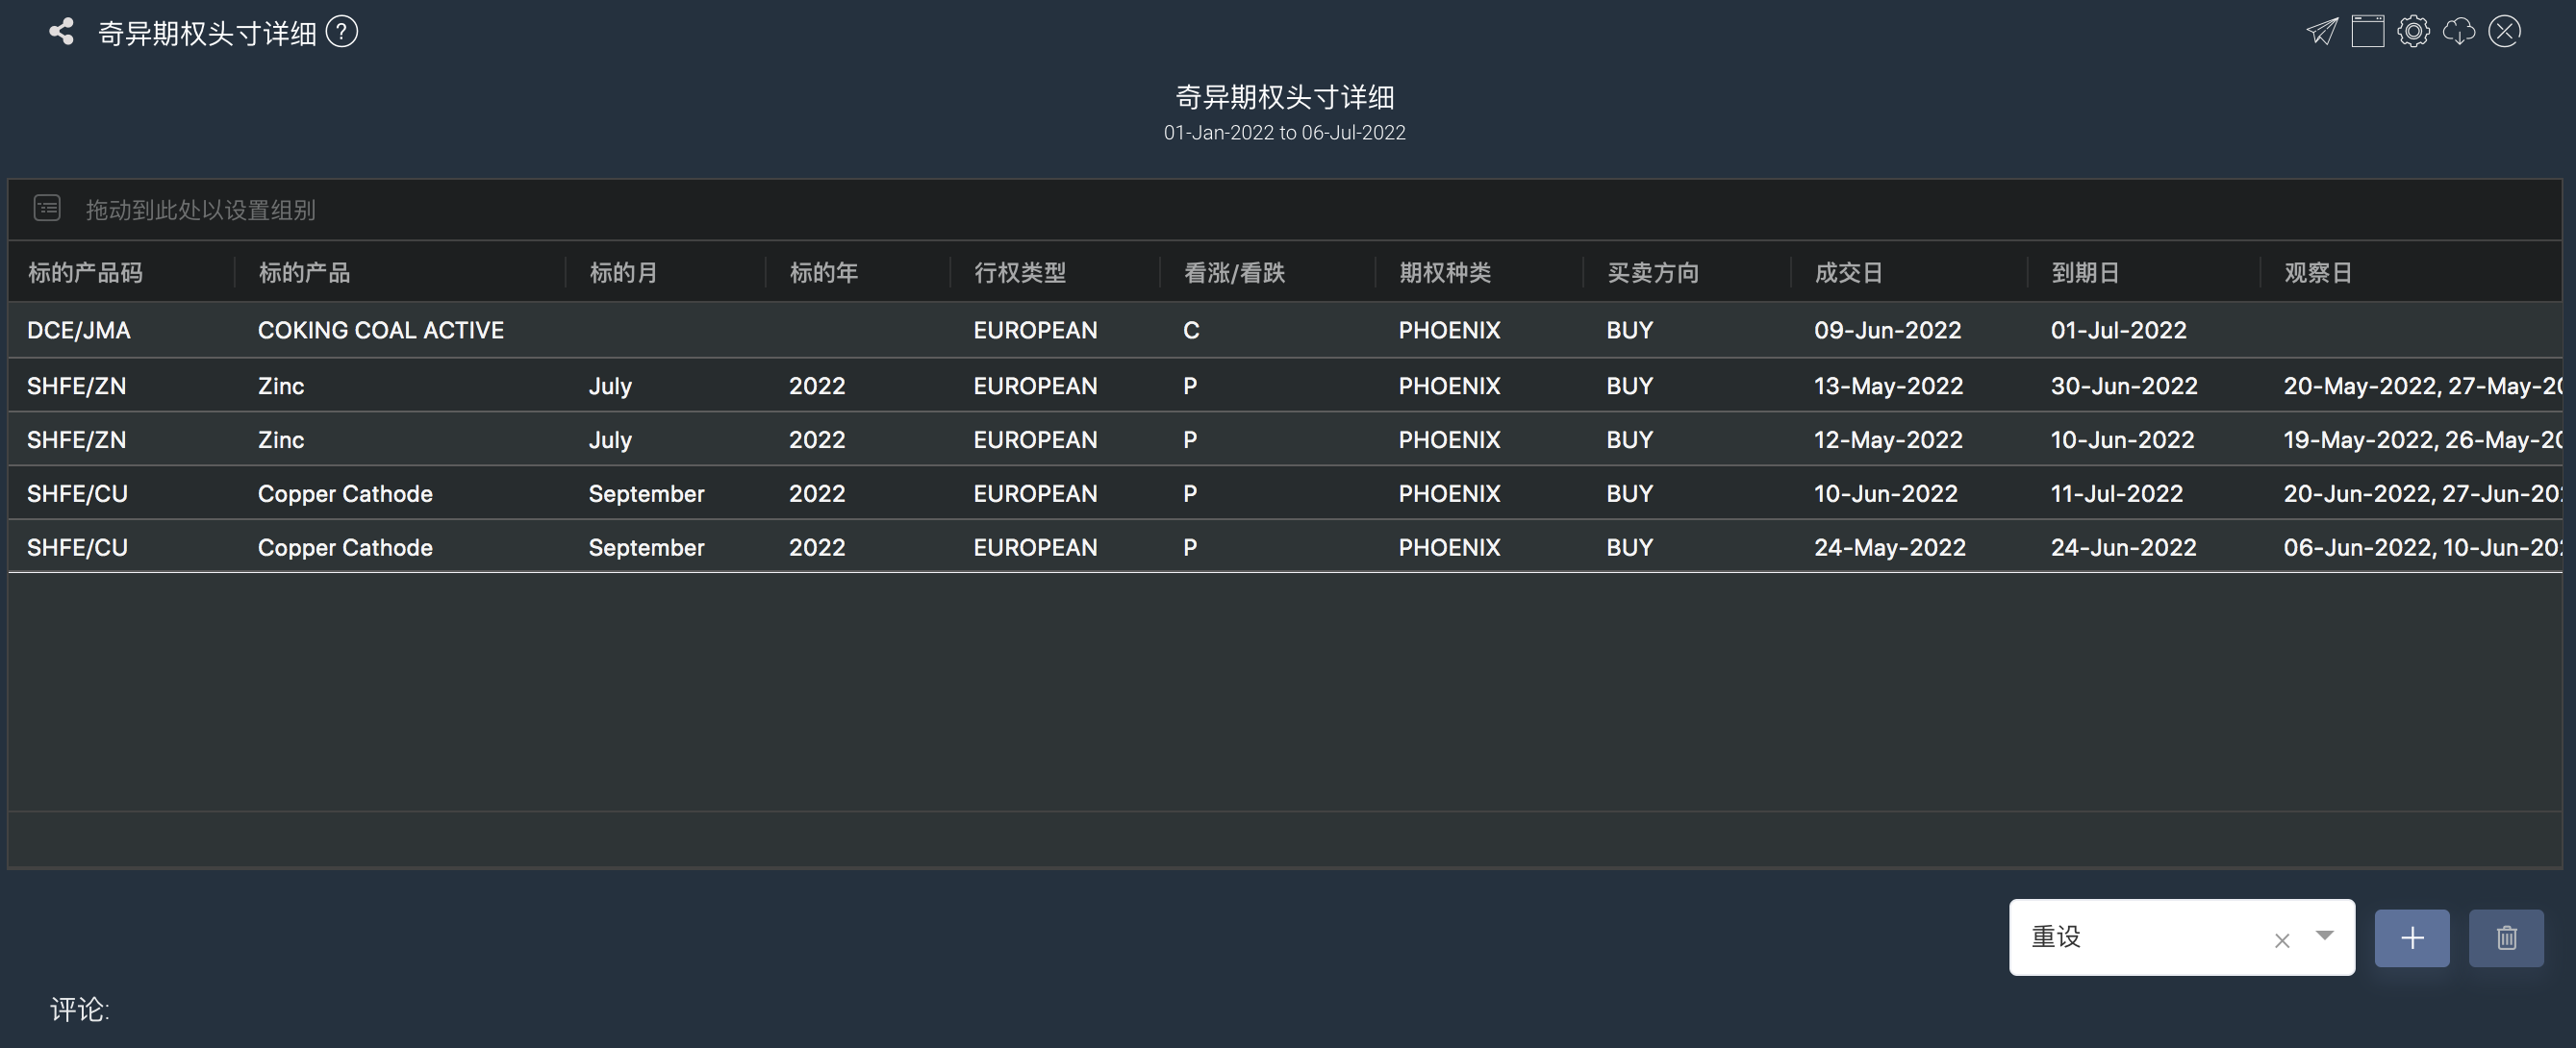
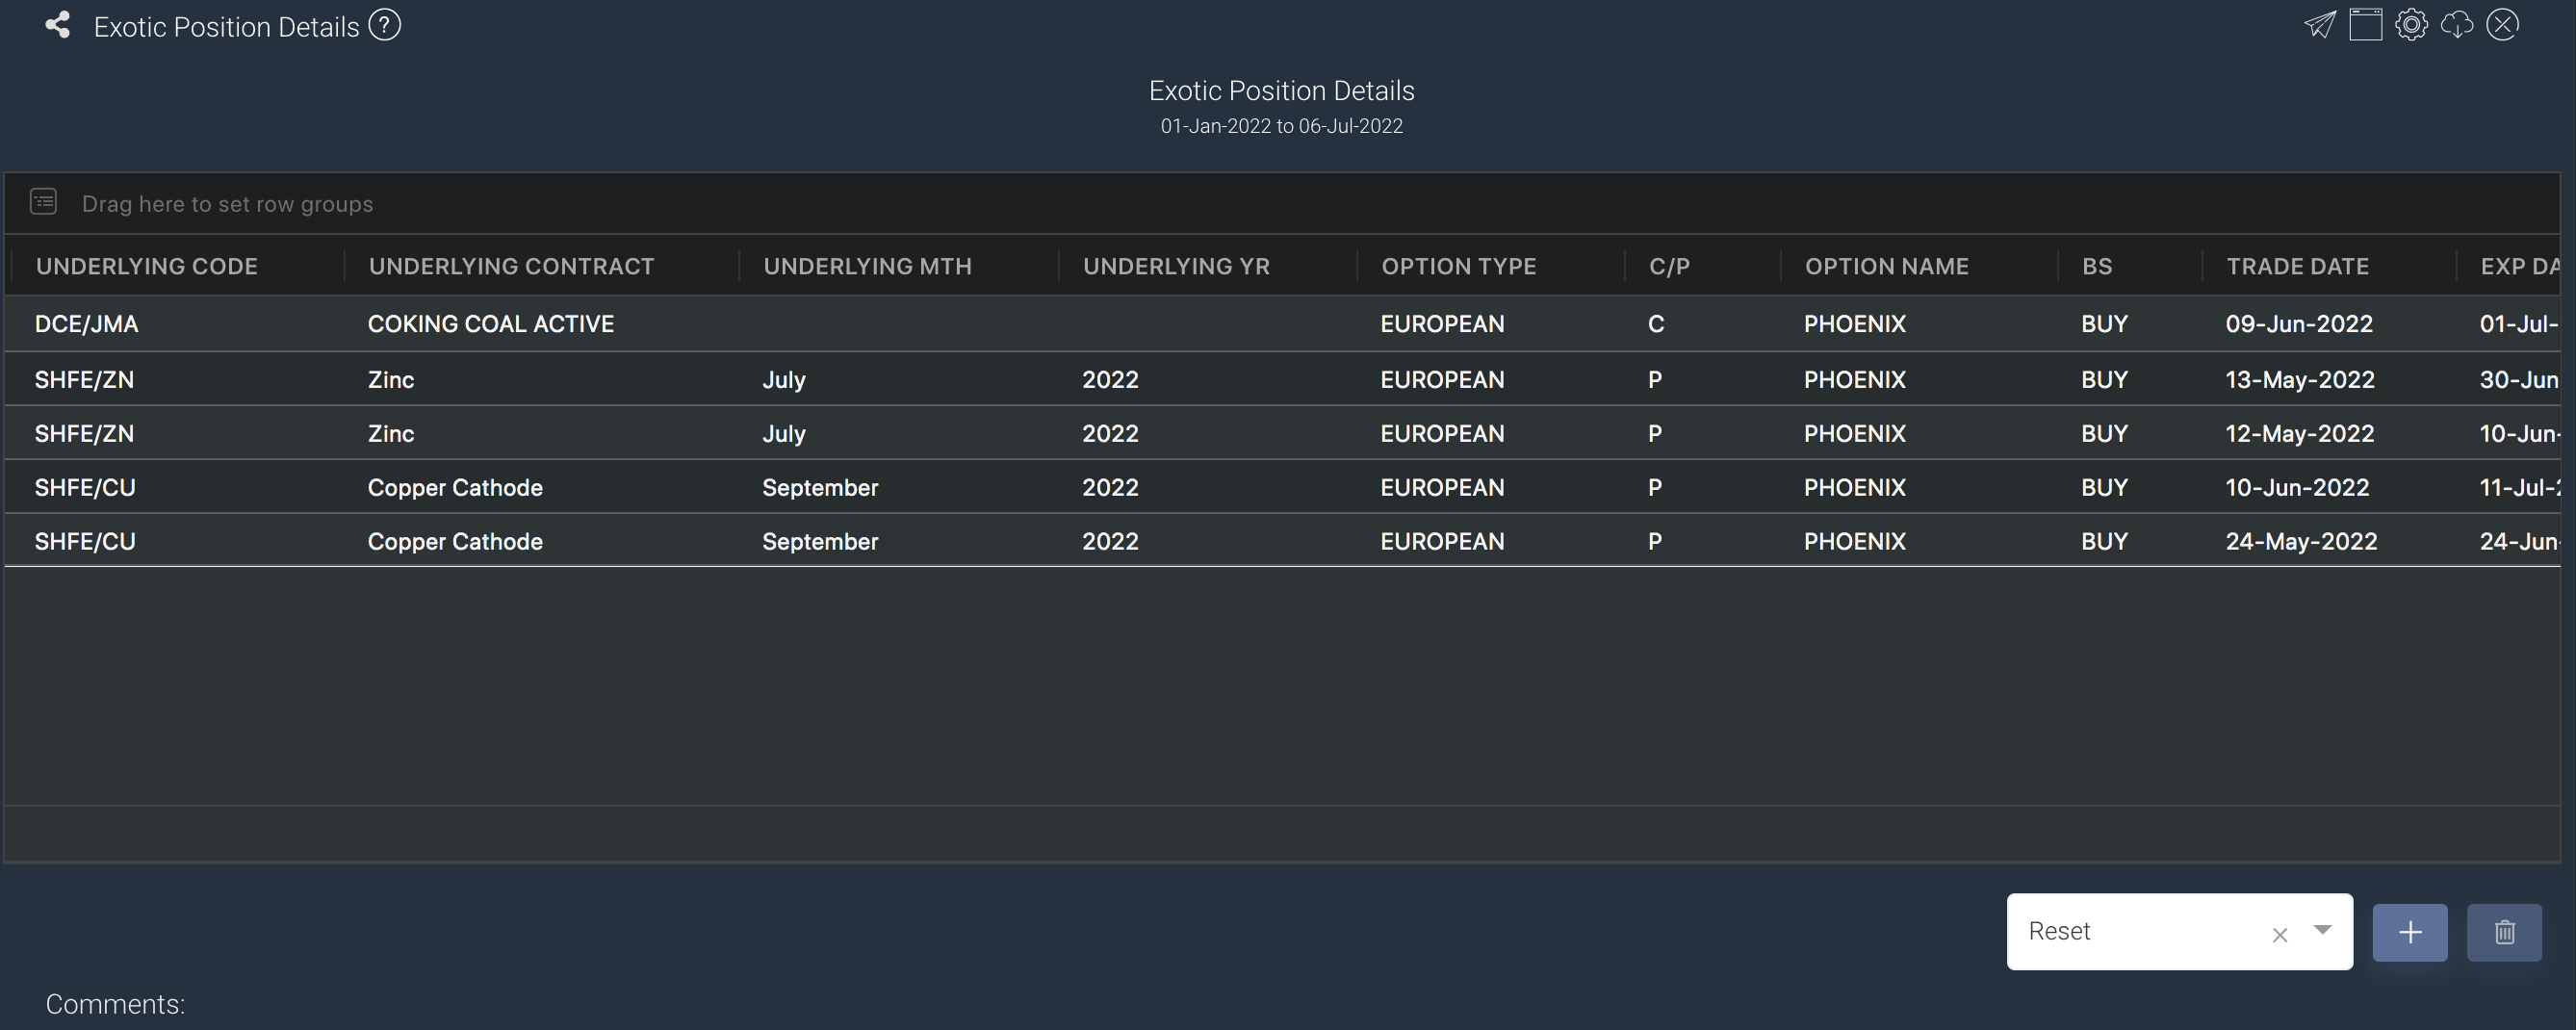
The Exotic Position Details model provides a summary of your exotic trades' positions details comprising of various data as follows:
| Column Name | Type | Details | Group Summary Row |
|---|---|---|---|
| EQUIV VANILLA ACTION | text | combination of BS and C/P | |
EQUIV UNDERLYING DIRECTION | text |
| |
| EQUIV UNDERLYING QTY | Number, phy qty decimals | QTY if EQUIV UNDERLYING DIRECTION == B else -QTY will display according to your inputs in Trades>Exotic Trades | |
UNDERLYING PRICE | Number, futures price decimals | will display according to your selected product in Trades>Exotic Trades | |
SETTLEMENT DATE | date | only closed trade has settlement date, it means when trade is closed will display according to your inputs in Trades>Exotic Trades | |
INIT PRICE | Number, futures price decimals | will display according to your inputs in Trades>Exotic Trades | |
KNOCK IN PRICE | Number, futures price decimals | will display according to your inputs in Trades>Exotic Trades | |
KNOCK OUT PRICE | Number, futures price decimals | will display according to your inputs in Trades>Exotic Trades | |
SIZE | Number, phy qty decimals Buy = + Sell = - | QTY if BS == BUY else - QTY will display according to your inputs in Trades>Exotic Trades | yes |
ANNU RATE % | Number, no limit | will display according to your inputs in Trades>Exotic Trades | |
KNOCK IN TRIGGERED 是否敲入 | text | will display according to your inputs in Trades>Exotic Trades. Check if it is triggered for knock in, you can check price path rows if any knock in | |
KNOCK IN TRIGGERING DATE | date | will display according to your inputs in Trades>Exotic Trades, if knock in triggered, it will show the1st time triggered knock in date | |
KNOCKED OUT TRIGGERED 是否敲出 | text | will display according to your inputs in Trades>Exotic Trades, will display if it is knocked out triggered, you can check in price path rows | |
POSITION COST 持仓成本 | Number, futures price decimals |
| |
INTEREST RECEIVED 到账收益 | Number, amount decimal | sum up all interests values in price path rows | yes |
P/L PROJECTION 预期收益 | Number, amount decimal |
| yes |
REALIZED P/L 平仓盈亏 | Number, amount decimal |
| yes |
CURRENT LOST 收盘引发即时盈亏 | Number, amount decimal |
| yes |
CURRENT P/L 权益 | Number, amount decimal |
| yes |
To categorise the trades according to your needs, you can reorganise your data by dragging-and-dropping the columns at the top of the table to 'set row groups'. Columns like Total Equity etc will be summed up accordingly.
Navigation
To access the quantitative model/report, click on 'Dashboard' from the navigation sidebar on the left.
Select the model/report from the drop-down list and click 'Create'. Click on the 'Settings' button (gear icon) at the top right corner of the model to set up your model/report.
Sharing Model/Report/Dashboard
To share the model with your group members, click on the "Share" button next to the Title of the model followed by the email address of the group members you want to share it with. Once submitted, the model will appear in the Dashboard>Group Dashboard of the selected group members.
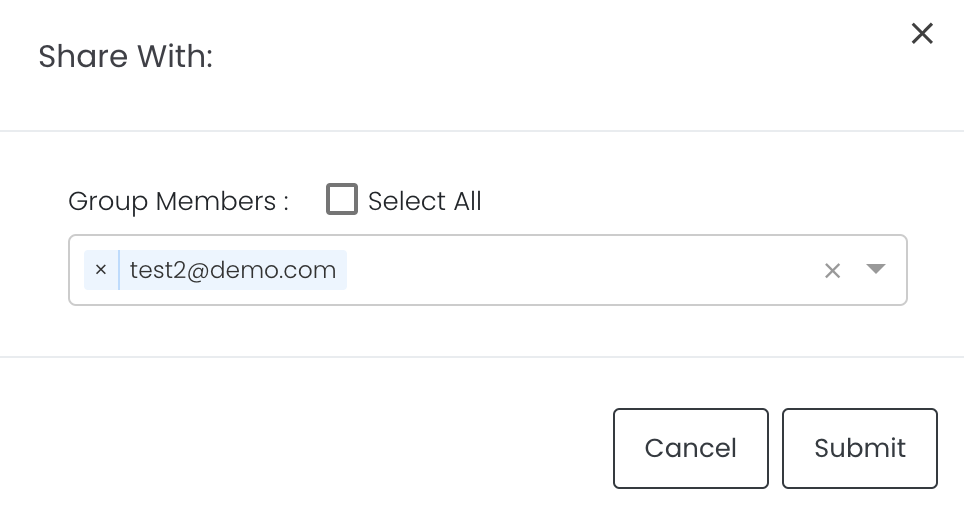
This is different from sharing individual or entire Dashboard models/reports, which allows any user who may or may not be users of MAF Cloud to access the individual model/entire dashboard via the shared web link (link will expire in 8 hours). In Group Dashboard, only group members can access the shared models/reports.
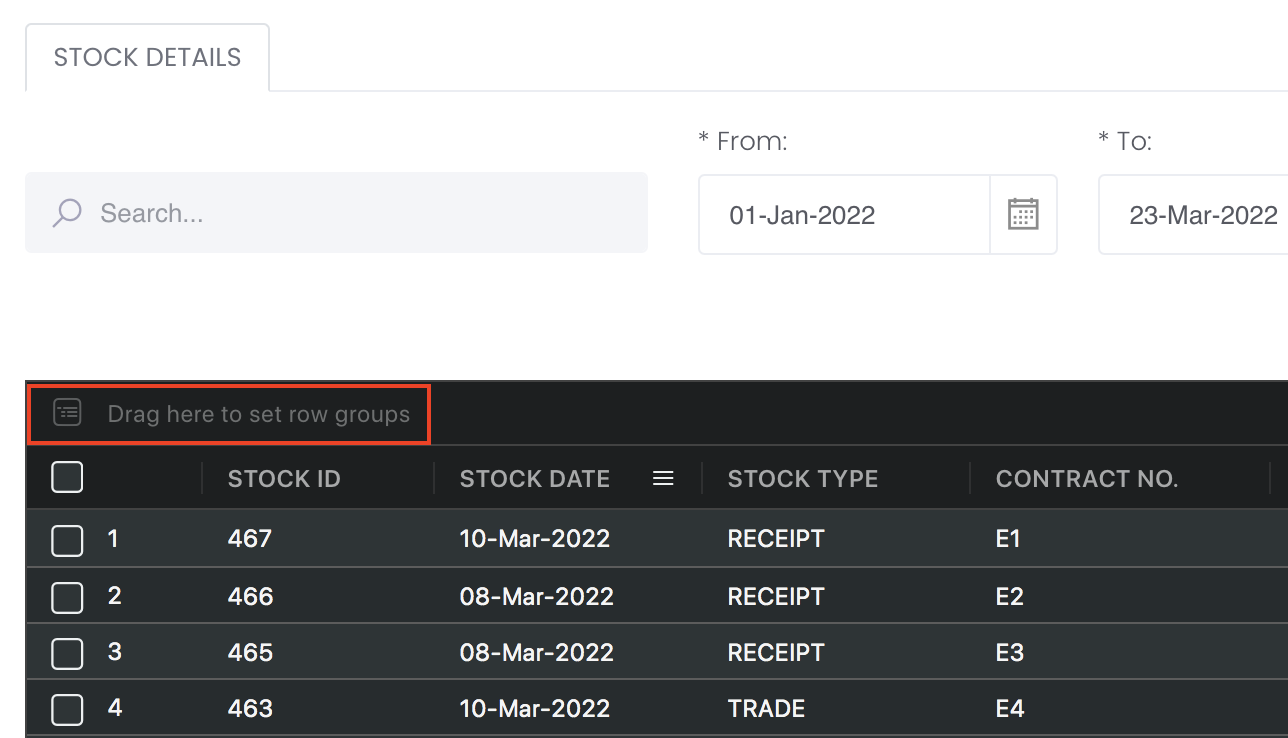
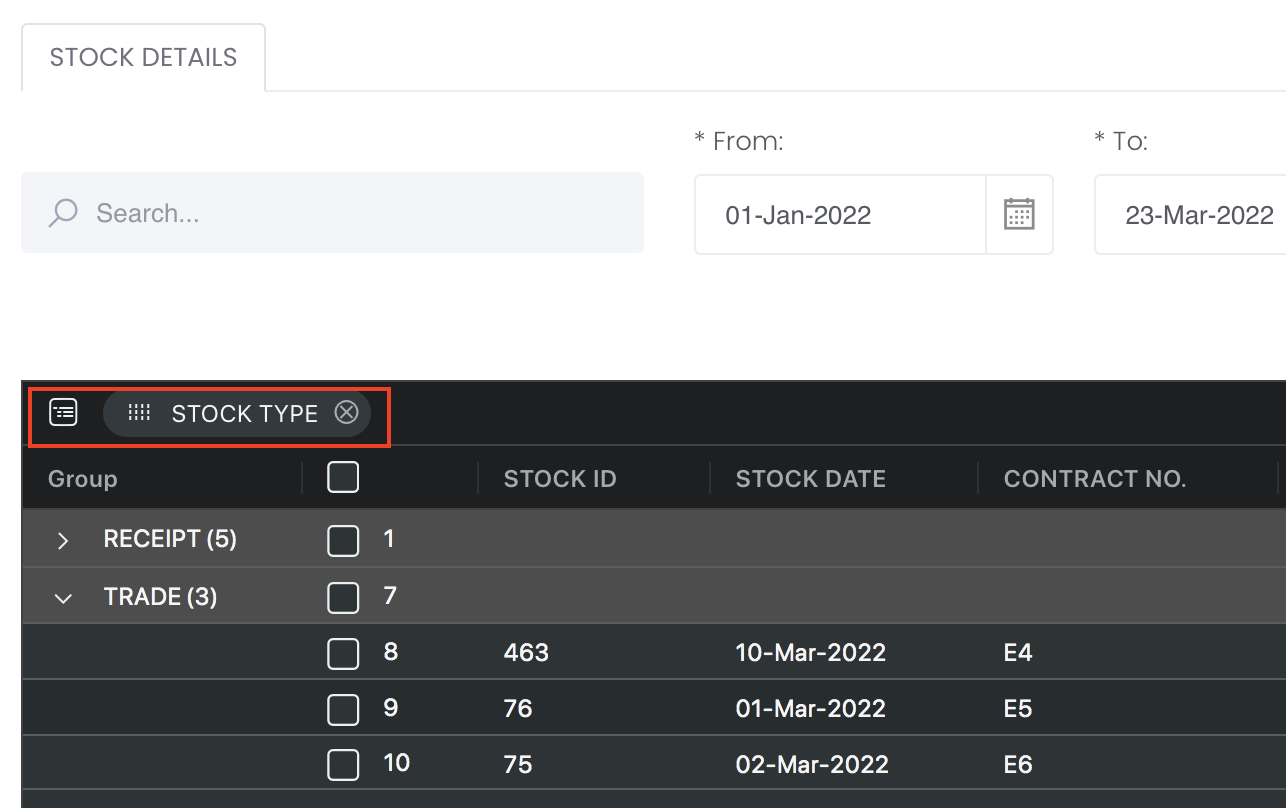
Group Rows
You may also group the rows (liken to the pivot table function in Microsoft Excel) to view the grouped data by dragging any column headers into the “row groups” section as highlighted:
Guide
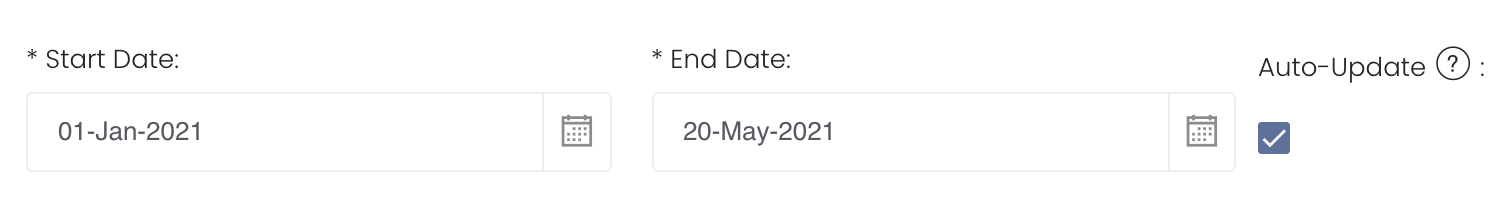
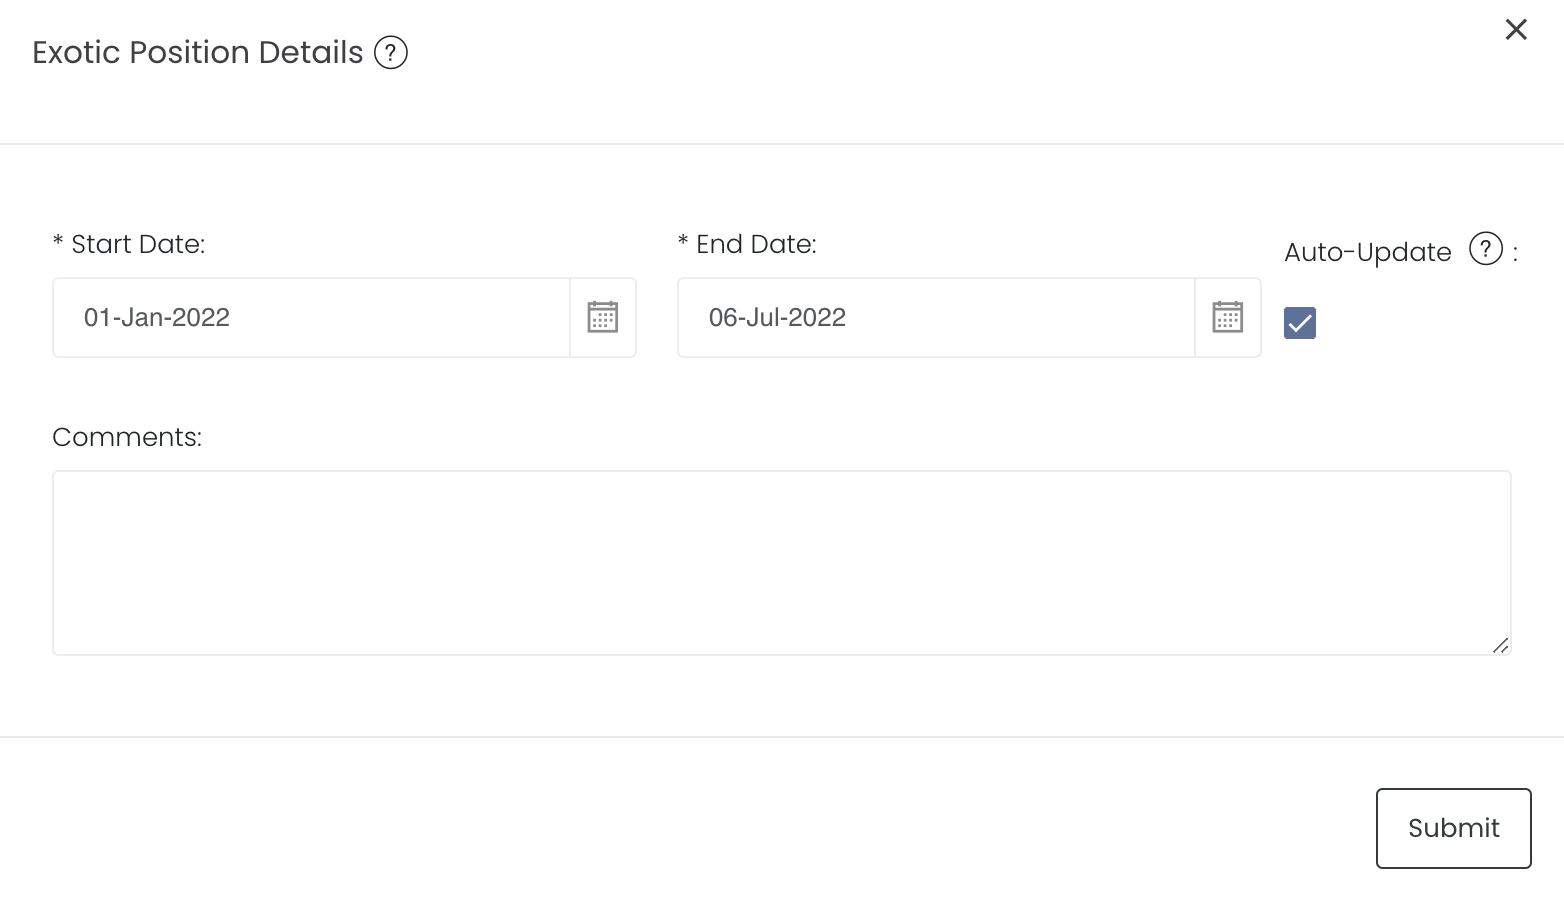
Duration |
Select the end date to determine the range of period and cut-off date for the calculations of P/L. End Date will be yesterday's date by default. End Date cannot be today's date. You are free to edit the dates as necessary. Auto-Update Tick: Resets the dates to default once you leave the ‘Dashboard’ page. Untick: Dates according to your settings remain unchanged once you leave the ‘Dashboard’ page. |
Comments |
The inserted comments will be displayed at the bottom of the application. This can be useful for documentation purposes or for settings description. |
Input
Name | Description | Type | Example |
|---|---|---|---|
| End Date | End of product time-series. | Date (YYYY-MM-DD) | 2019-06-14 |
| Auto Update | Tick: Resets the dates to default once you leave the ‘Dashboard’ page. Untick: Dates according to your settings remain unchanged once you leave the ‘Dashboard’ page. | Checkbox | - |
| Comments | Useful for documentation purposes or for settings description. | Text | - |
Output
Description | Type | |
|---|---|---|
Product/Strategy Information | Provides an overview of all the open positions in your portfolio. You can reorganise your data by dragging-and-dropping the columns at the top of the table to 'set row groups'. | Text |
Example
Functionality
Please refer to Table Settings for table functionalities.
Definition of Terms
Please refer to List of Definitions: Trades.
Click to access: