Position Matrix
- IT Support
- Snakehead
- e0031959 (Unlicensed)
Return to Overview
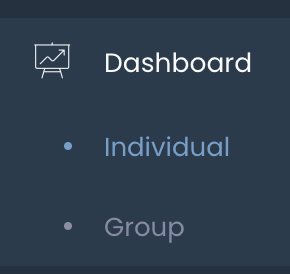
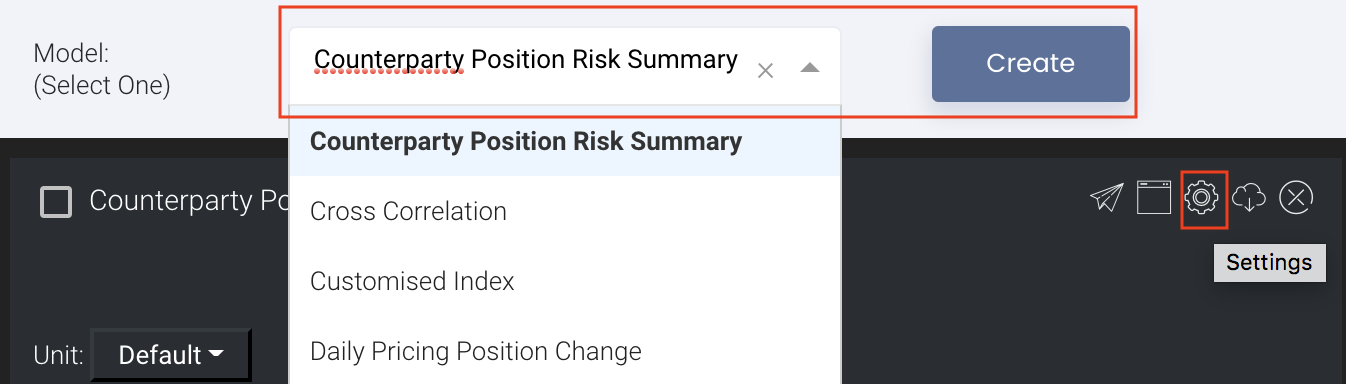
To access the quantitative model/report, click on 'Dashboard' from the navigation sidebar on the left. Select the model/report from the drop-down list and click 'Create'. Click on the 'Settings' button (gear icon) at the top right corner of the model to set up your model/report.
About
The Position Matrix displays all paper and physical trades with open net positions. Please note that only open positions will be displayed in the Position Matrix. Open positions refer to trades without actual price but with/without title transfer dates. This means that any trades with actual price will be considered closed and not show in the Position Matrix. This works differently from the open positions in the portfolio page where trades without actual price and/or title transfer date will remain open.
The rows are the various products in the portfolio, while the columns indicate product information such as exchange, product type, contract type, time to maturity, and their net positions. In this model, the user can create customised 'strategies', such as spread positions of futures with different maturities. The user can choose if the effect of the additional strategies will be shown (see: Creating a Strategy Product).
(Also see Futures Contracts Codes for more information on exchange and month codes, if required.)
Navigation
To access the quantitative model/report, click on 'Dashboard' from the navigation sidebar on the left.
Select the model/report from the drop-down list and click 'Create'. Click on the 'Settings' button (gear icon) at the top right corner of the model to set up your model/report.
Sharing Model/Report/Dashboard
To share the model with your group members, click on the "Share" button next to the Title of the model followed by the email address of the group members you want to share it with. Once submitted, the model will appear in the Dashboard>Group Dashboard of the selected group members.

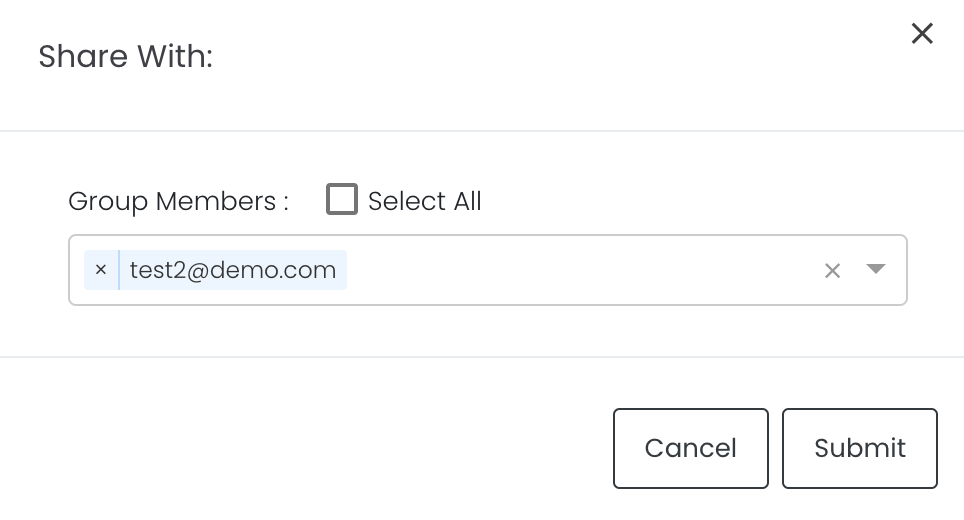
This is different from sharing individual or entire Dashboard models/reports, which allows any user who may or may not be users of MAF Cloud to access the individual model/entire dashboard via the shared web link (link will expire in 8 hours). In Group Dashboard, only group members can access the shared models/reports.
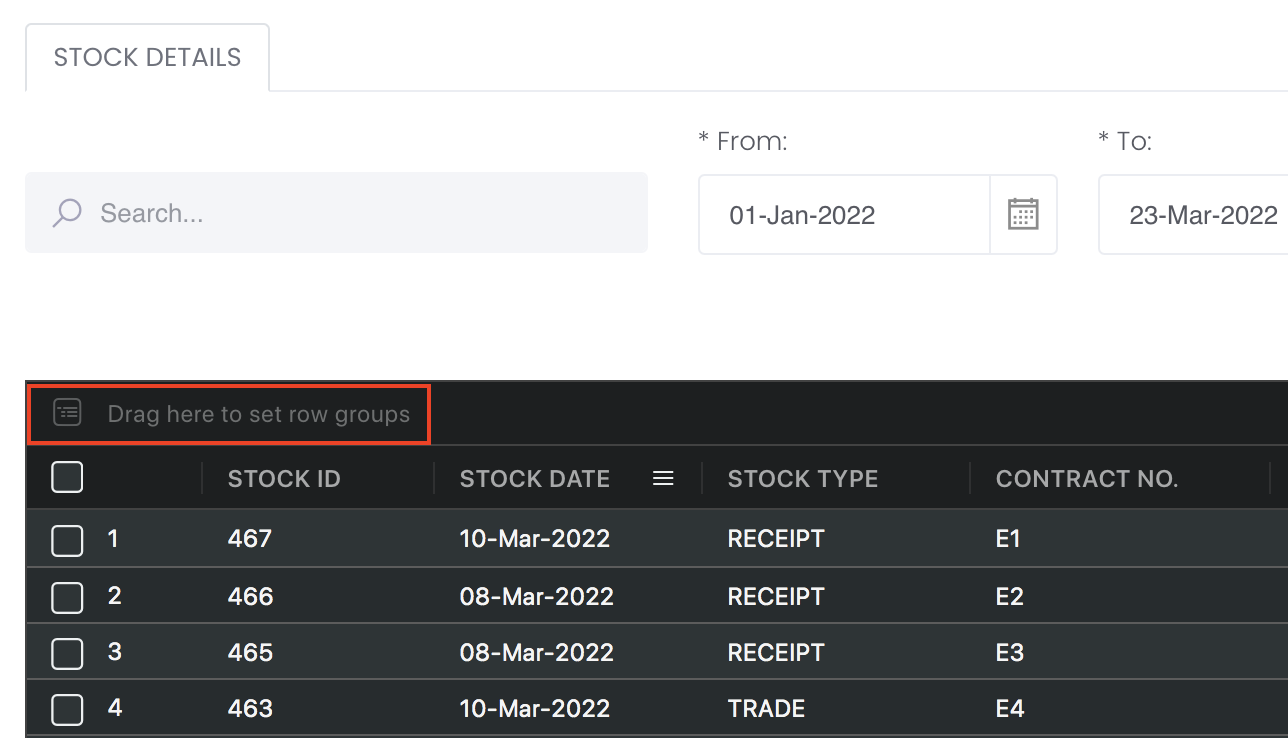
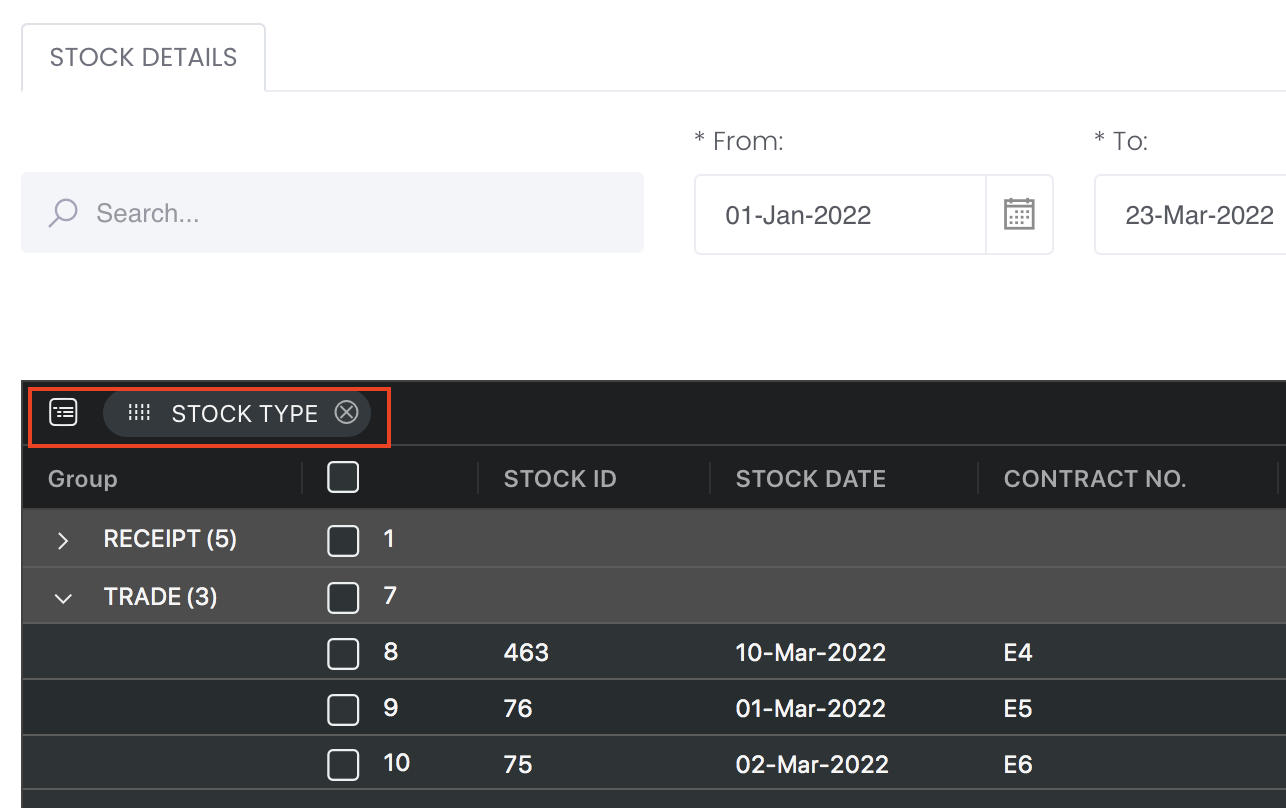
Group Rows
You may also group the rows (liken to the pivot table function in Microsoft Excel) to view the grouped data by dragging any column headers into the “row groups” section as highlighted:
Guide
| Name | Image/Description |
|---|---|
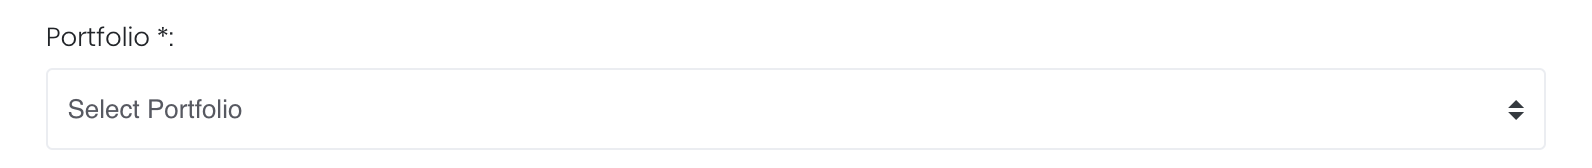
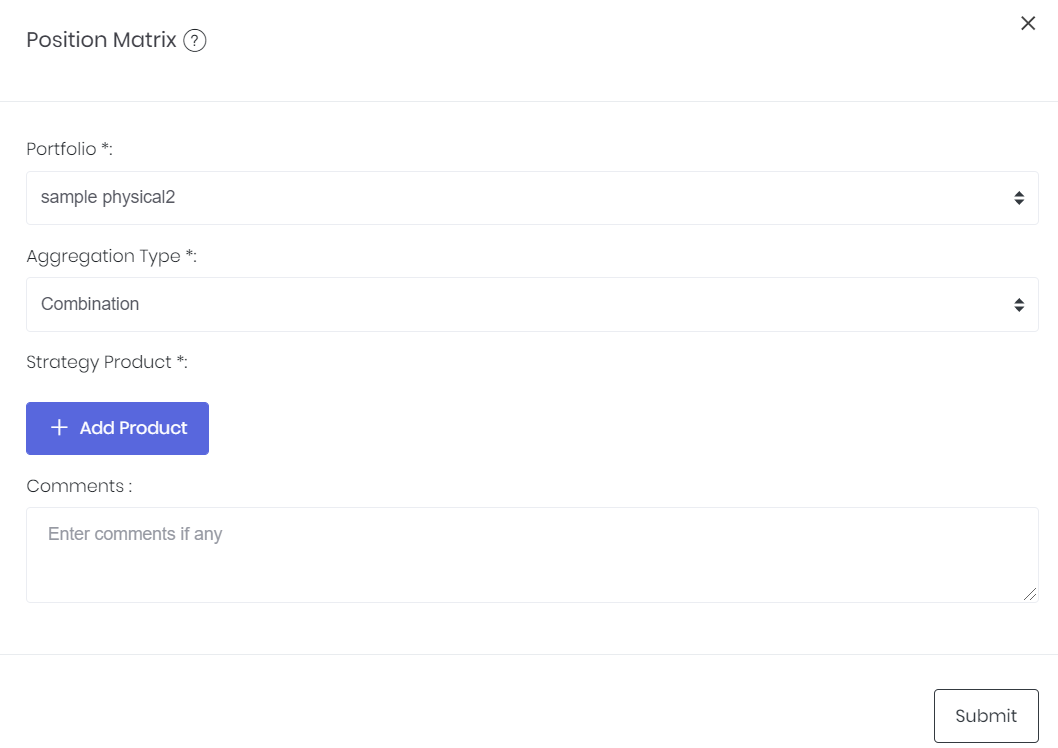
| Portfolio |
Select a/multiple portfolio(s) of interest. |
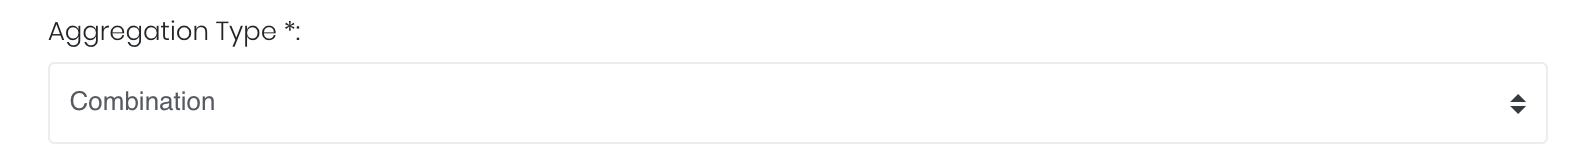
| Aggregation Type |
|
Group Sum | Allow user to opt to auto sum group rows:
|
| Swap Flag |
|
| Position Conversion |
|
| Comments |
|

Input
| Description | Type | Example | |
|---|---|---|---|
| Portfolio | Portfolio of interest. | Portfolio (Selection) | ABC |
| Aggregation Type | Type of aggregation to be used. | Type | Combination |
| Strategy Product(s) | Strategy products to be evaluated together according to the aggregation type. | Product | Coffee, Sugar |
| Comments | Text | - |
Output
The output table shows the net positions of each contract of the portfolio, with the following information:
| Name | Description | Type |
|---|---|---|
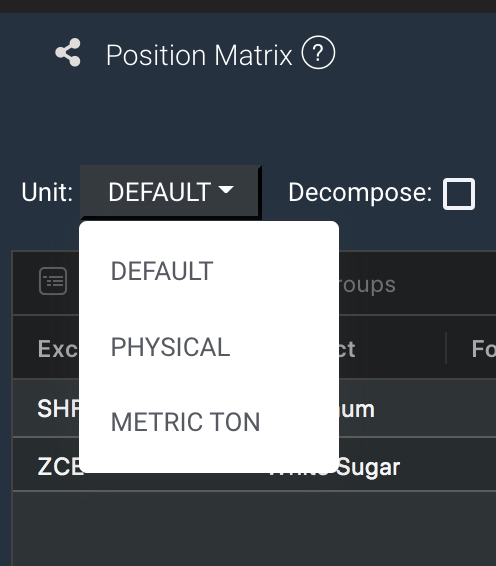
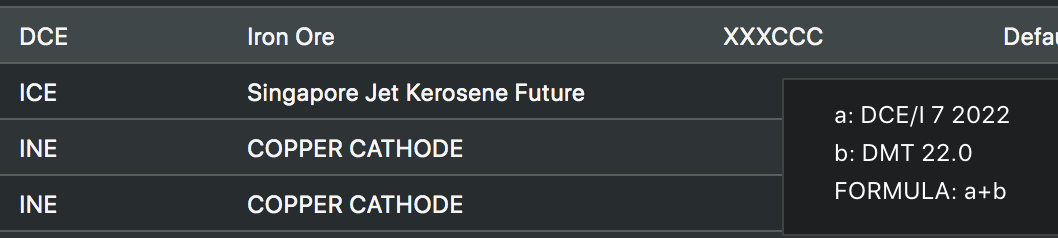
| Product/Strategy Information | The details of product(s) are indicated in the first 3 columns, which include the product name, broker, account, instrument and type of product(s). For strategies, these were manually filled in by the user when creating the strategy. You can click on the Unit dropdown list and select the units you want your trades to be displayed in. If PHYSICAL is selected, it will show the positions quantity in its original physical units, whereas METRIC TON will show the positions quantity calculated in metric ton. FORMULA PRICING:
| Text |
| Product/Strategy Positions | The remaining columns display the positions of the products and/or strategies; they are arranged in chronological order, with the month indicated at the heading of each column. | Number |
Please note that once the positions have expired, they will not be shown in the model. You can go to View Portfolio to view all your open and closed positions.
Example
For example,
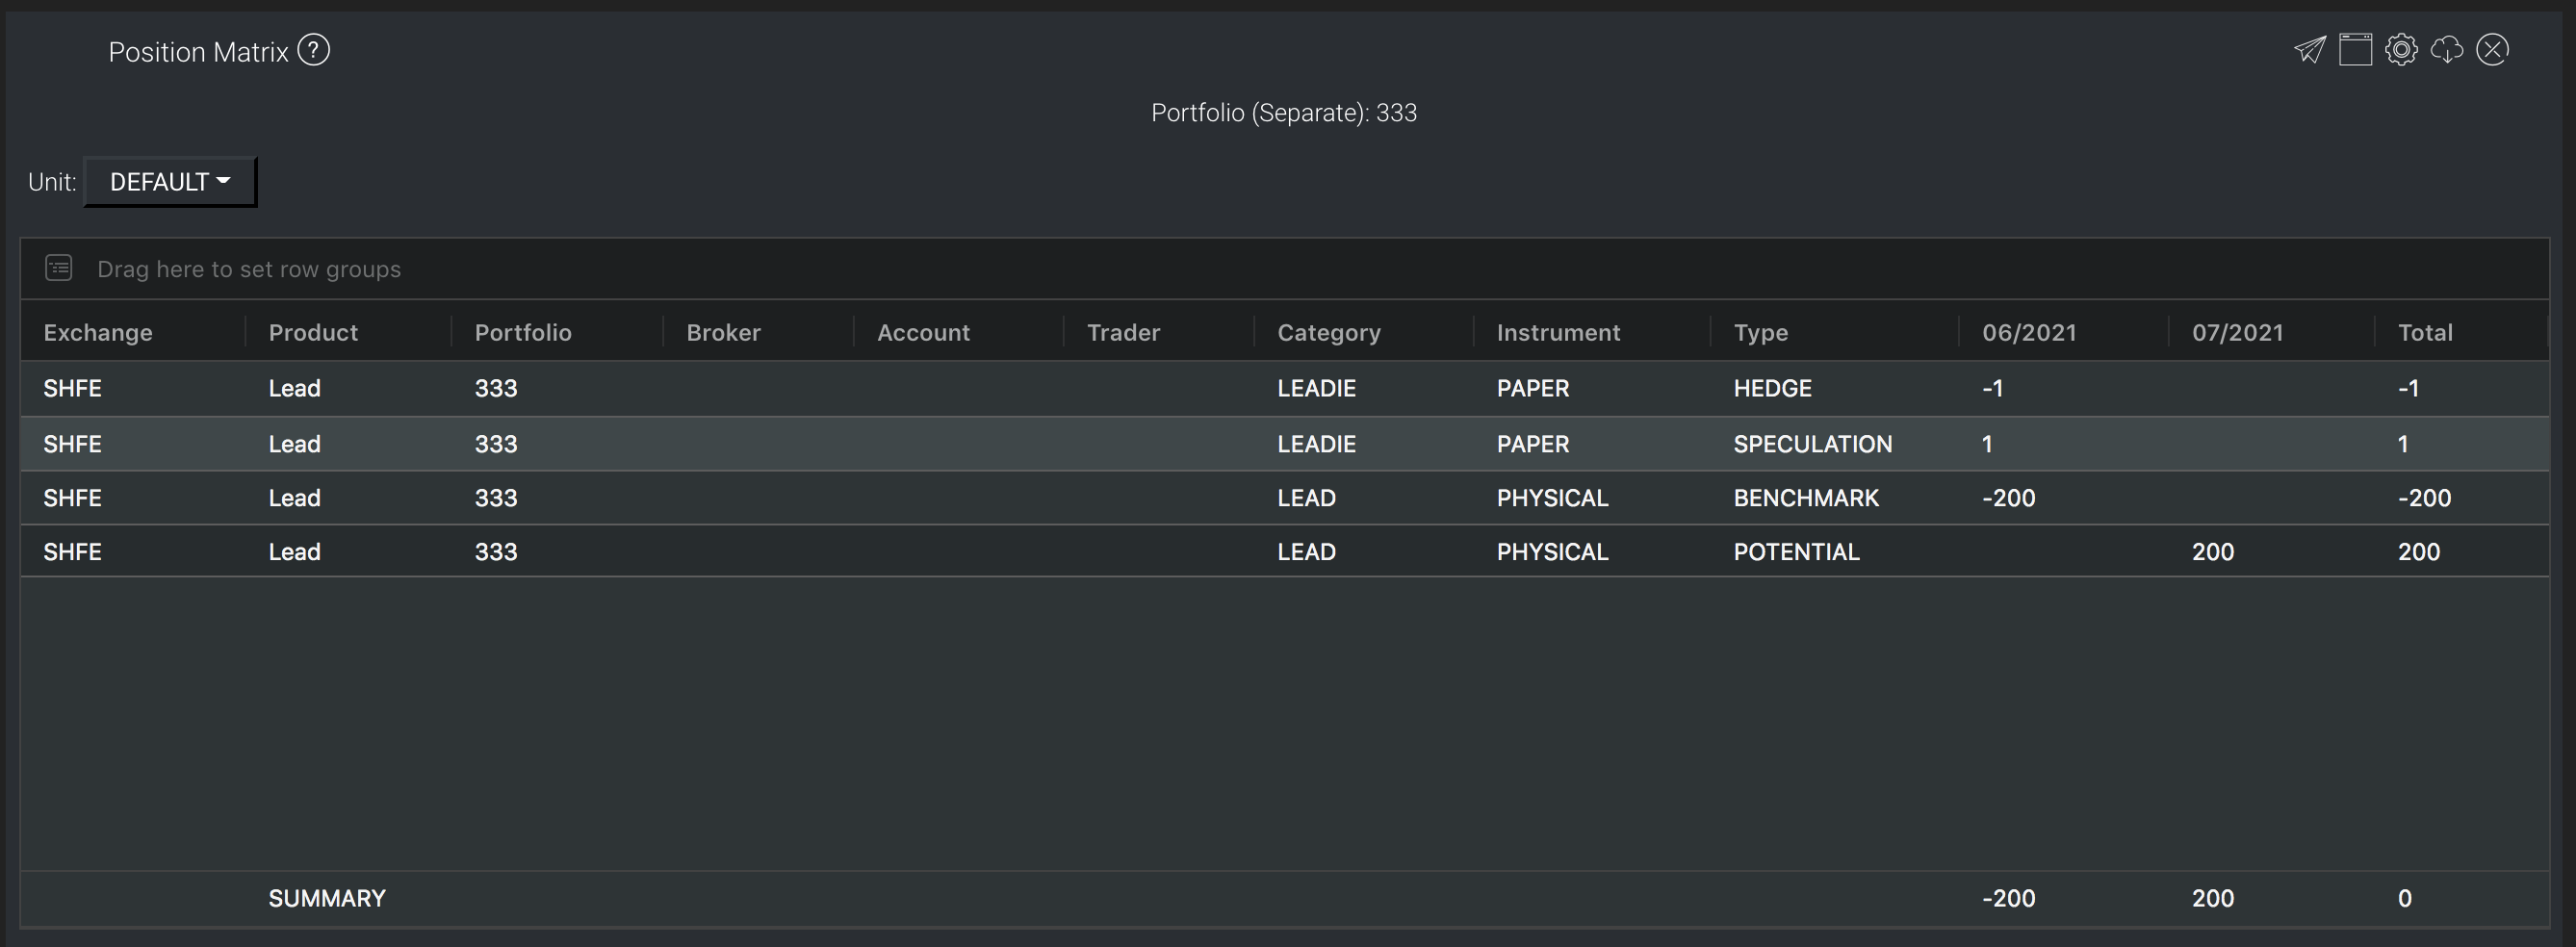
Buy 1 contract with trade type: speculation
Sell 1 contract with trade type: hedge
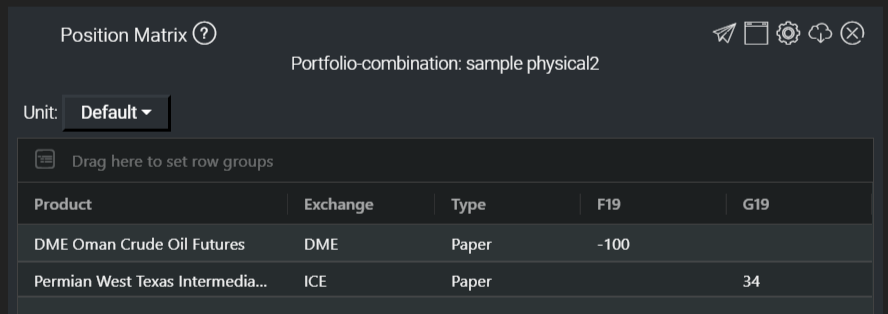
Put them into same portfolio and in Position Matrix, if Separate in Aggregation Type is selected, the trades will show separately like this:
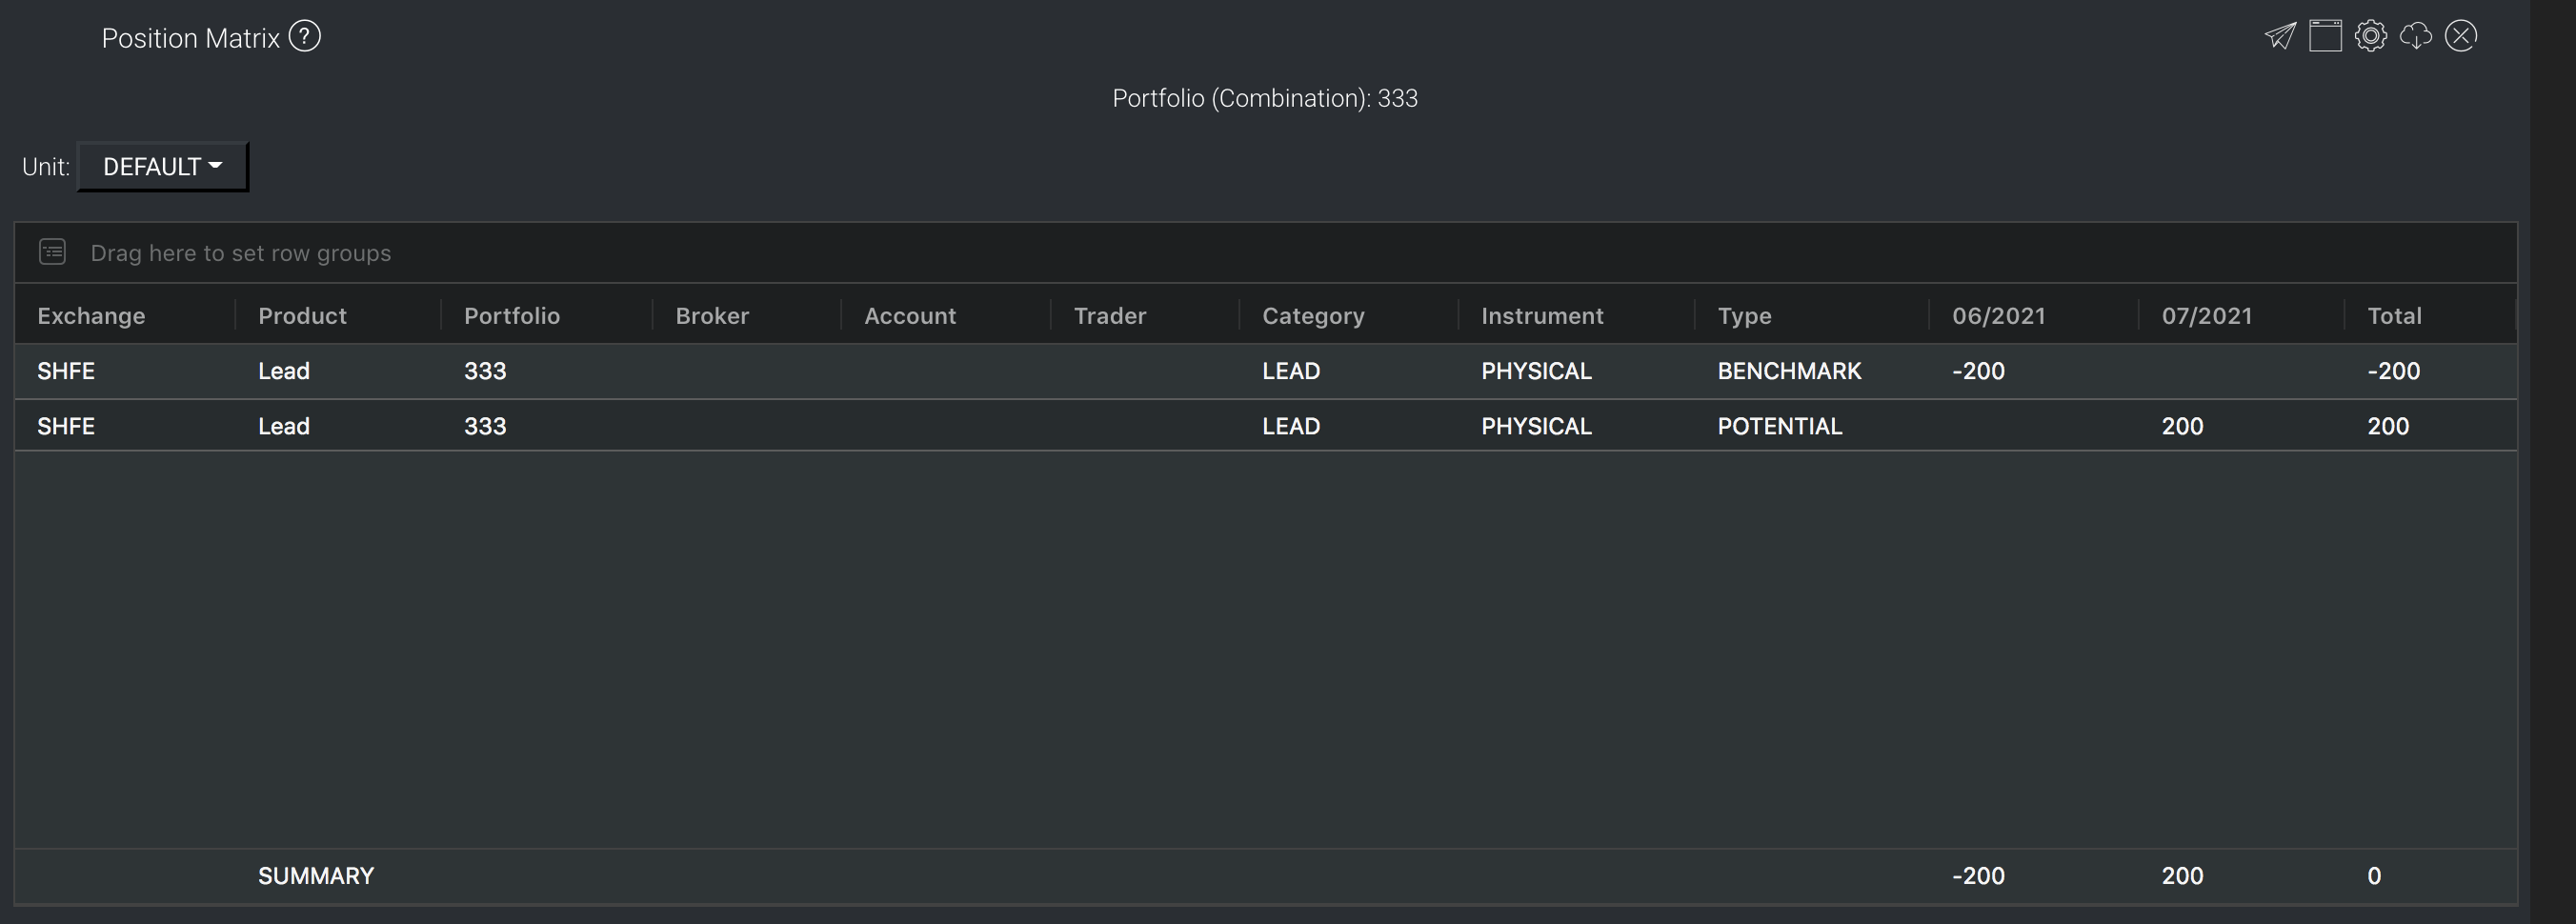
If Combination in Aggregation Type is selected, the trades will net off and will not appear in the Position Matrix like this:
Functionality
- Unit Selection: Users may choose the units (default, lots, barrels etc.) in which the position sizes are to be displayed.
- Please refer to Table Settings for table functionalities.
Click to access: