Forward Curve Table
- Herougan No (Unlicensed)
- IT Support
- e0031959 (Unlicensed)
About
(Similar to the Forward Curve Model, also see Futures Contracts Codes.)
The Forward Curve Table displays the prices of forward contracts of a product in tabular format. The columns comprise of days on which the forward contracts are traded, while the rows comprise of the various times of physical delivery of the product (maturity dates). Viewing the forward curves in a tabular format will allow users to see the contracts' prices more precisely, while easily comparing across trading days and maturity times.
Additional Function: The raw contract prices are shown on the left; scroll right to see 2 more columns of the percentage changes and cumulative percentage changes from one delivery month to the next for each trading day.
Navigation
To access the quantitative model/report, click on 'Dashboard' from the navigation sidebar on the left.
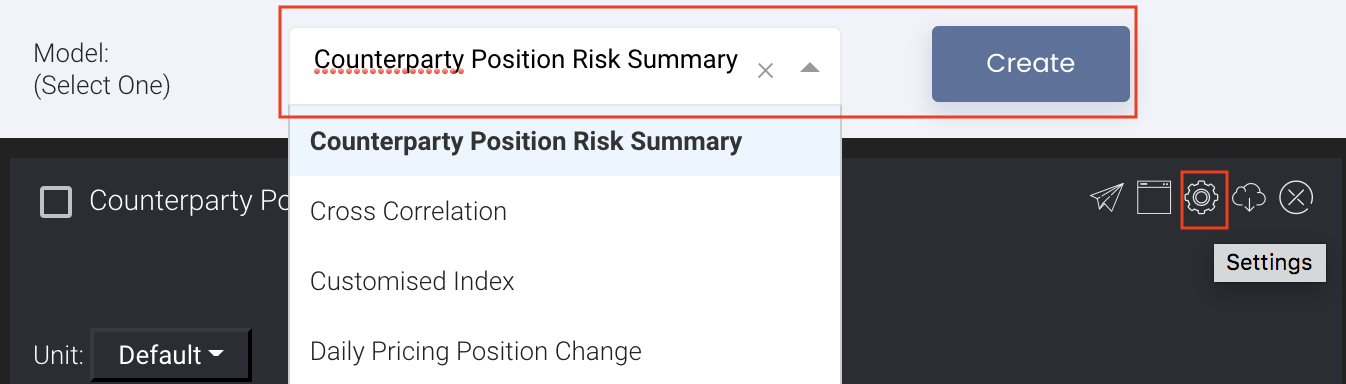
Select the model/report from the drop-down list and click 'Create'. Click on the 'Settings' button (gear icon) at the top right corner of the model to set up your model/report.
Sharing Model/Report/Dashboard
To share the model with your group members, click on the "Share" button next to the Title of the model followed by the email address of the group members you want to share it with. Once submitted, the model will appear in the Dashboard>Group Dashboard of the selected group members.

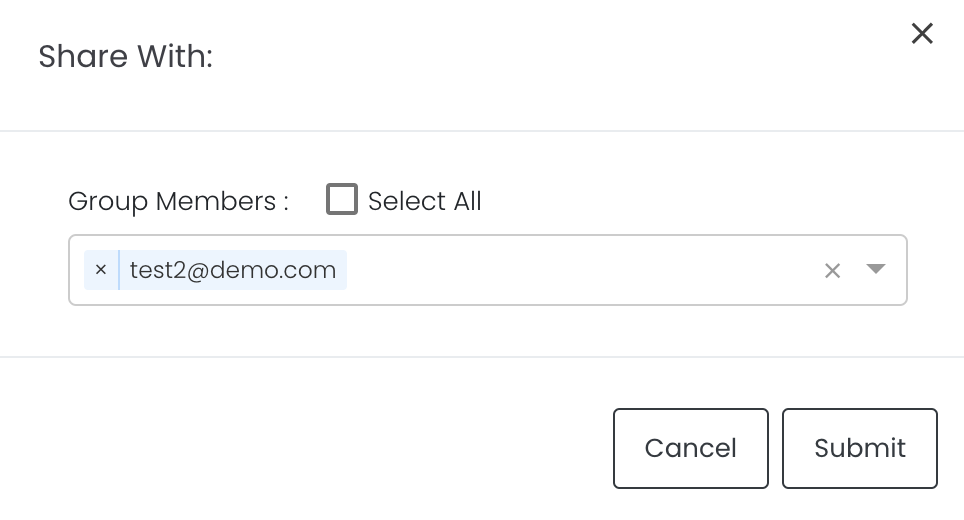
This is different from sharing individual or entire Dashboard models/reports, which allows any user who may or may not be users of MAF Cloud to access the individual model/entire dashboard via the shared web link (link will expire in 8 hours). In Group Dashboard, only group members can access the shared models/reports.
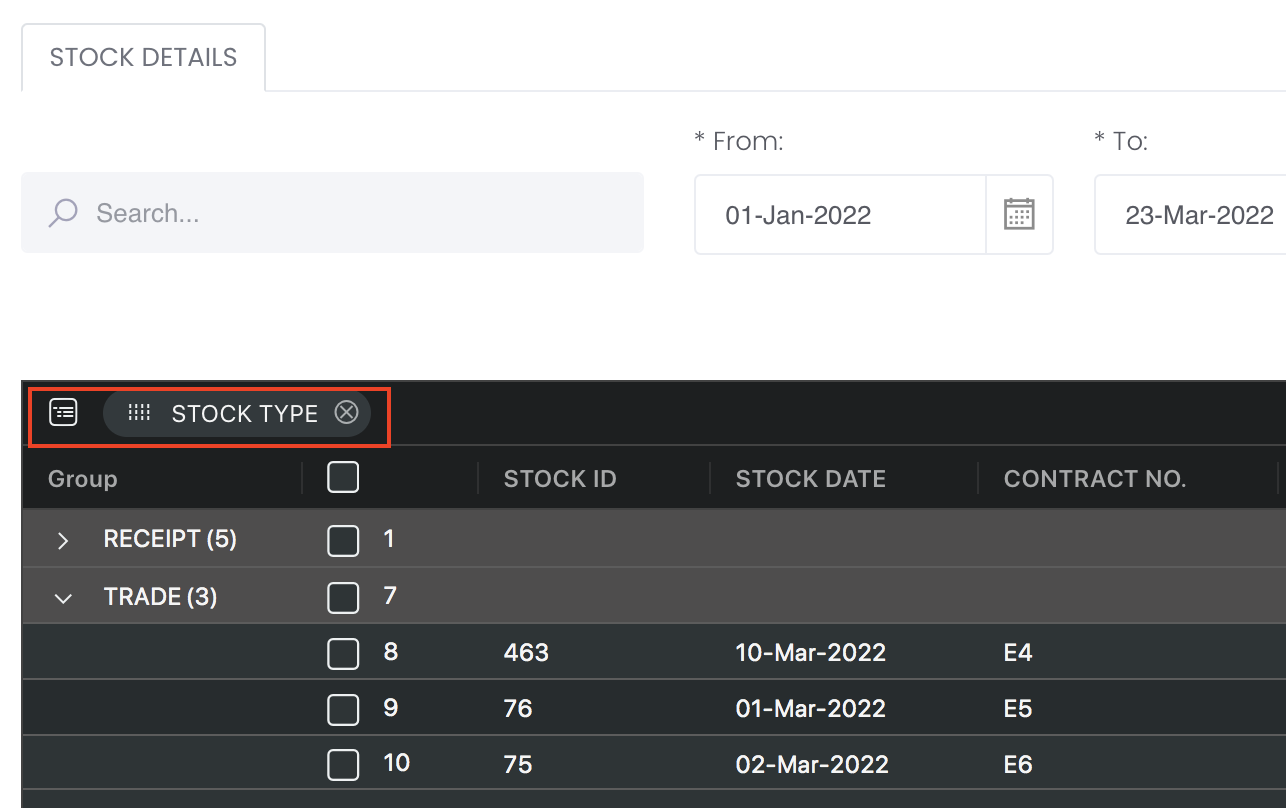
Group Rows
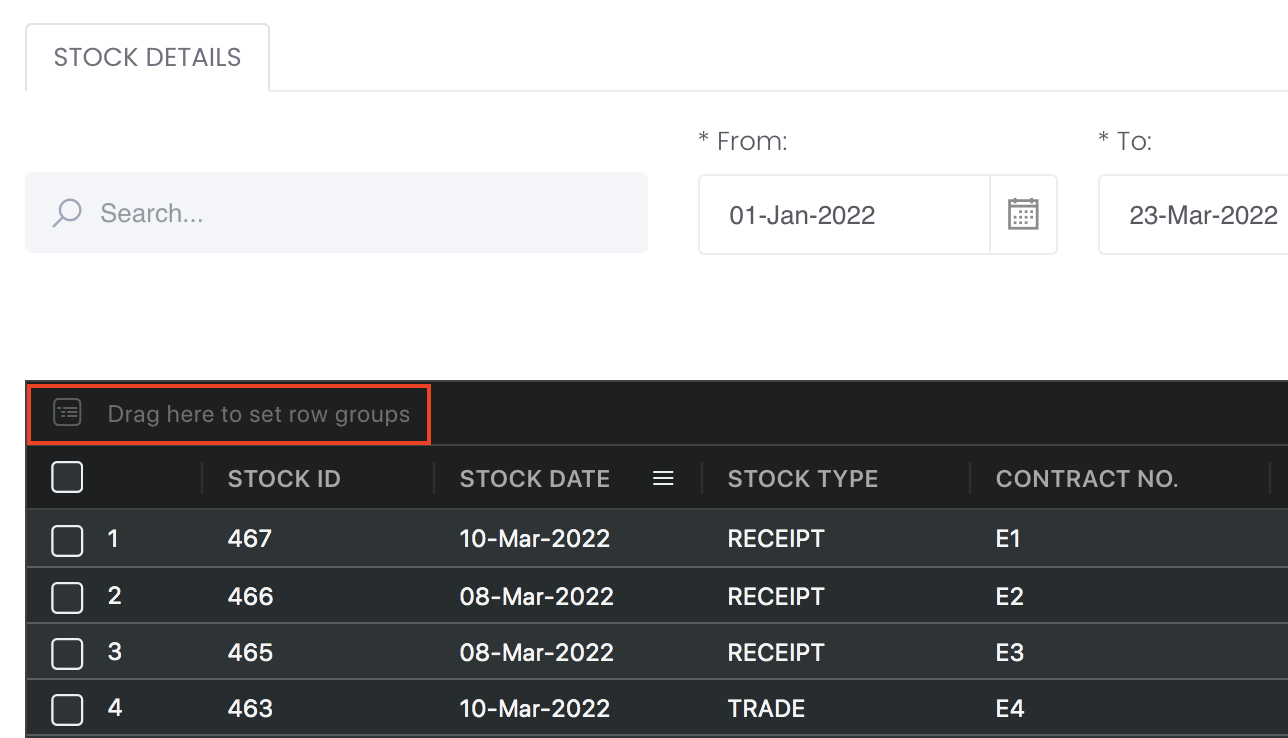
You may also group the rows (liken to the pivot table function in Microsoft Excel) to view the grouped data by dragging any column headers into the “row groups” section as highlighted:
Guide
| Name | Image/Description |
|---|---|
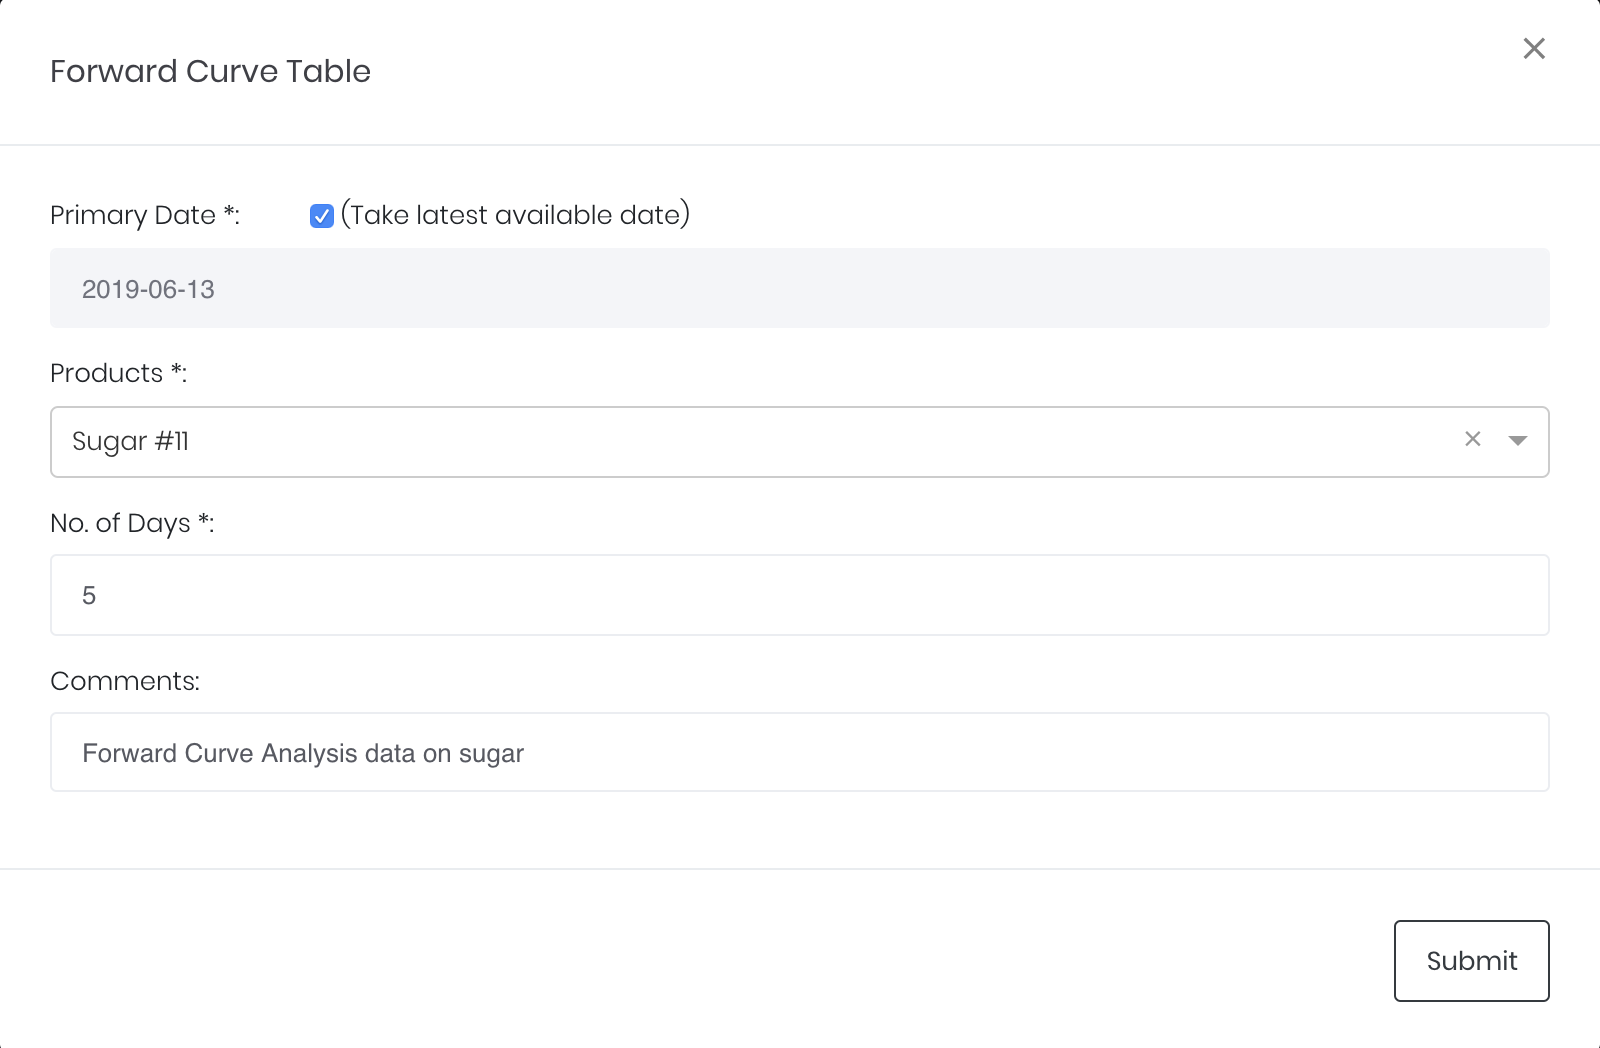
| Primary Date | 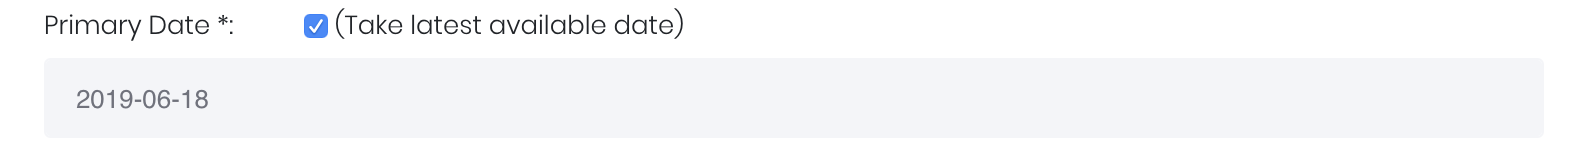 This date indicates the end of the product time series, where the forward curves are projected from. If the checkbox is ticked, this date will be automatically updated to the latest date upon refresh/reload. |
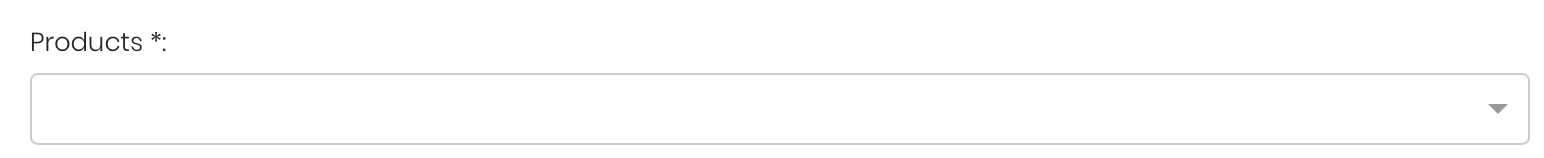
| Product(s) |
Input product(s) of interest under 'Product'. |
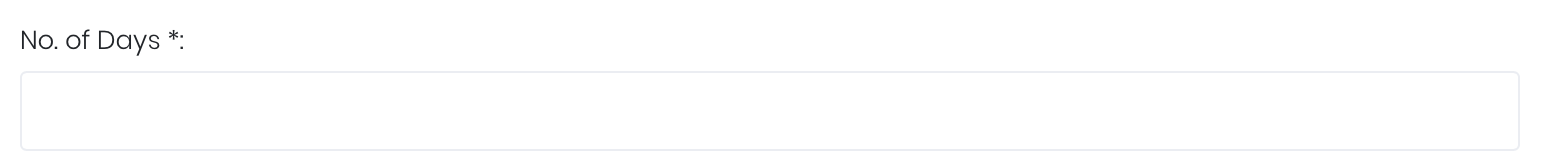
| Days |
The user can select the number of days for which forward curve data is to be generated in the table (eg. if no. of days = 3, data for the latest 3 days are displayed). This allows the user to view recent price movements. |
| Comments |
The inserted comments will be displayed at the bottom of the application. This can be useful for documentation purposes or for settings description. |
Input
| Description | Type | Example | |
|---|---|---|---|
| Primary Date | End date of which product values are displayed. | Date (YYYY-MM-DD) | 2019-07-01 |
| Product | Product of interest. | Product | Sugar #11 |
| Days | Number of days for which futures prices are displayed, up till and including the end date. | Numerical Value | 10 |
| Comments | Useful for documentation purposes or for settings description. | Text | - |
Output
| Name | Description | Type |
|---|---|---|
| Forward Curve Table | Displays forward curve data in a tabular format. | Table |
Example
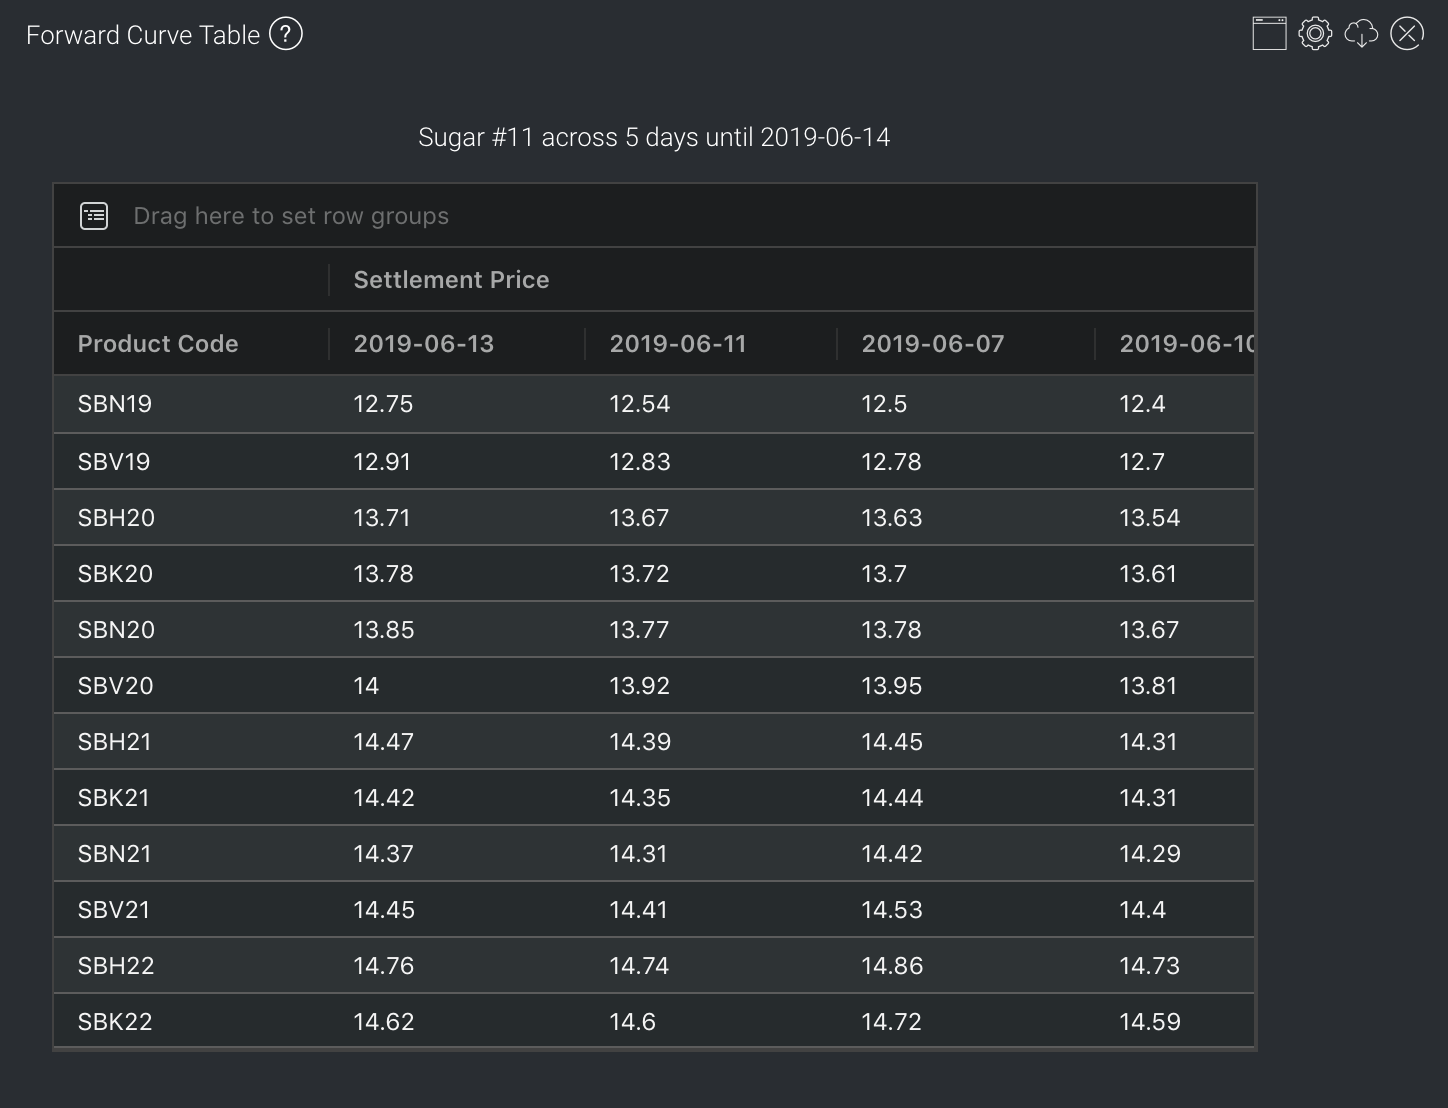
Displayed are the futures prices for Sugar #11 contracts for 5 days, with various times of maturity.
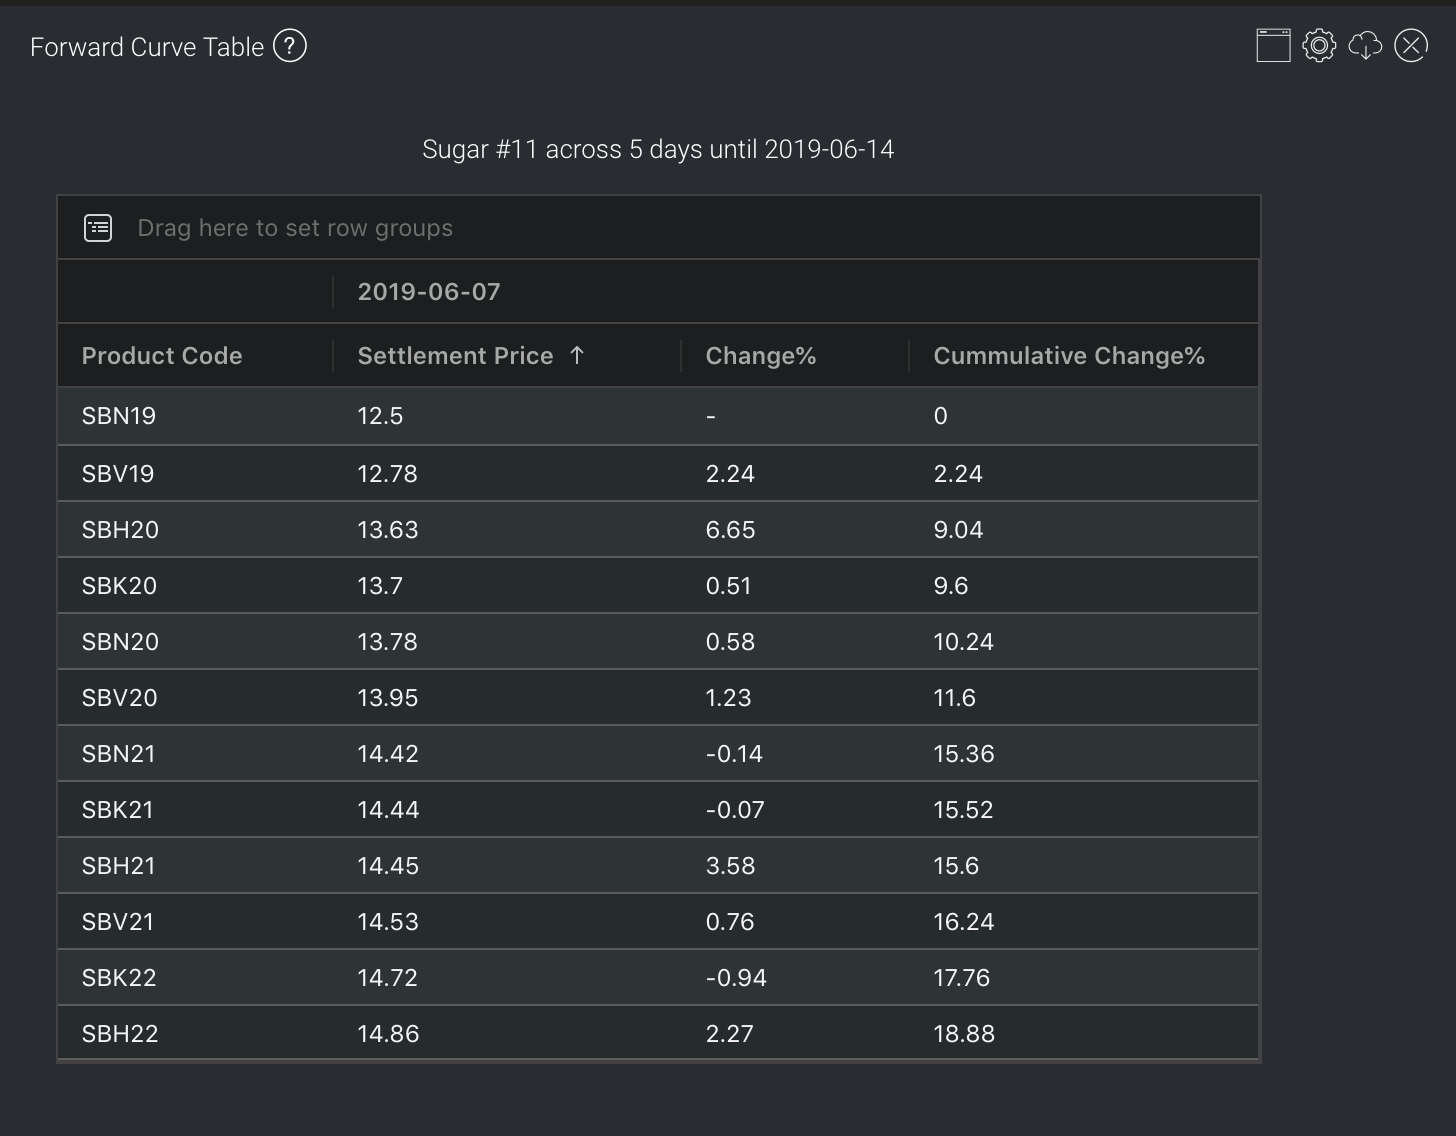
In this table, the contracts (of different maturities) are rearranged according to their prices in ascending order. Shown on the right are percentage changes from the previous month (maturity date is 1 month earlier) and nearest month (first contract to expire), respectively.
Functionality
Please refer to Table Settings for table functionalities.
Click to access: