Exotic Account Details
- IT Support
Return to Overview
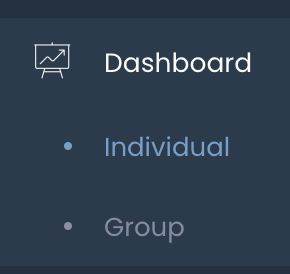
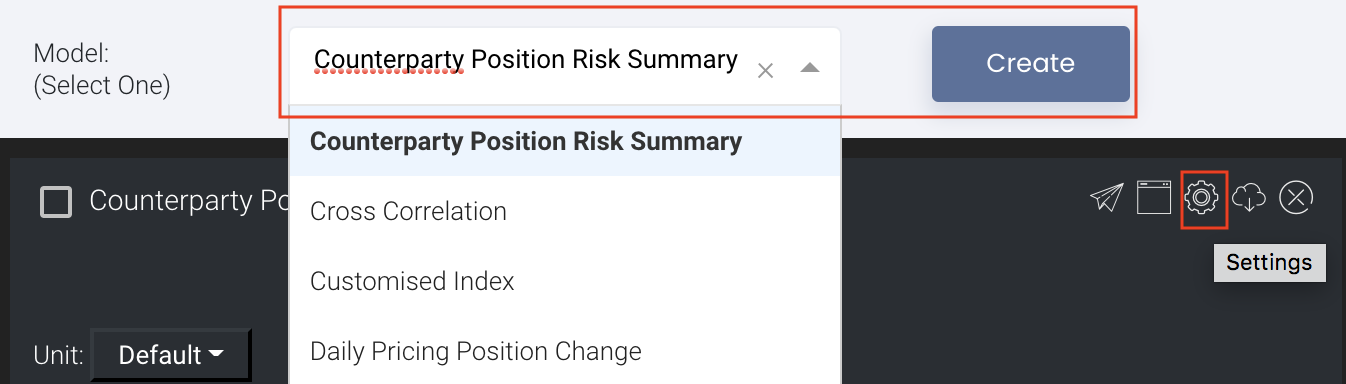
To access the quantitative model/report, click on 'Dashboard' from the navigation sidebar on the left. Select the model/report from the drop-down list and click 'Create'. Click on the 'Settings' button (gear icon) at the top right corner of the model to set up your model/report.
About
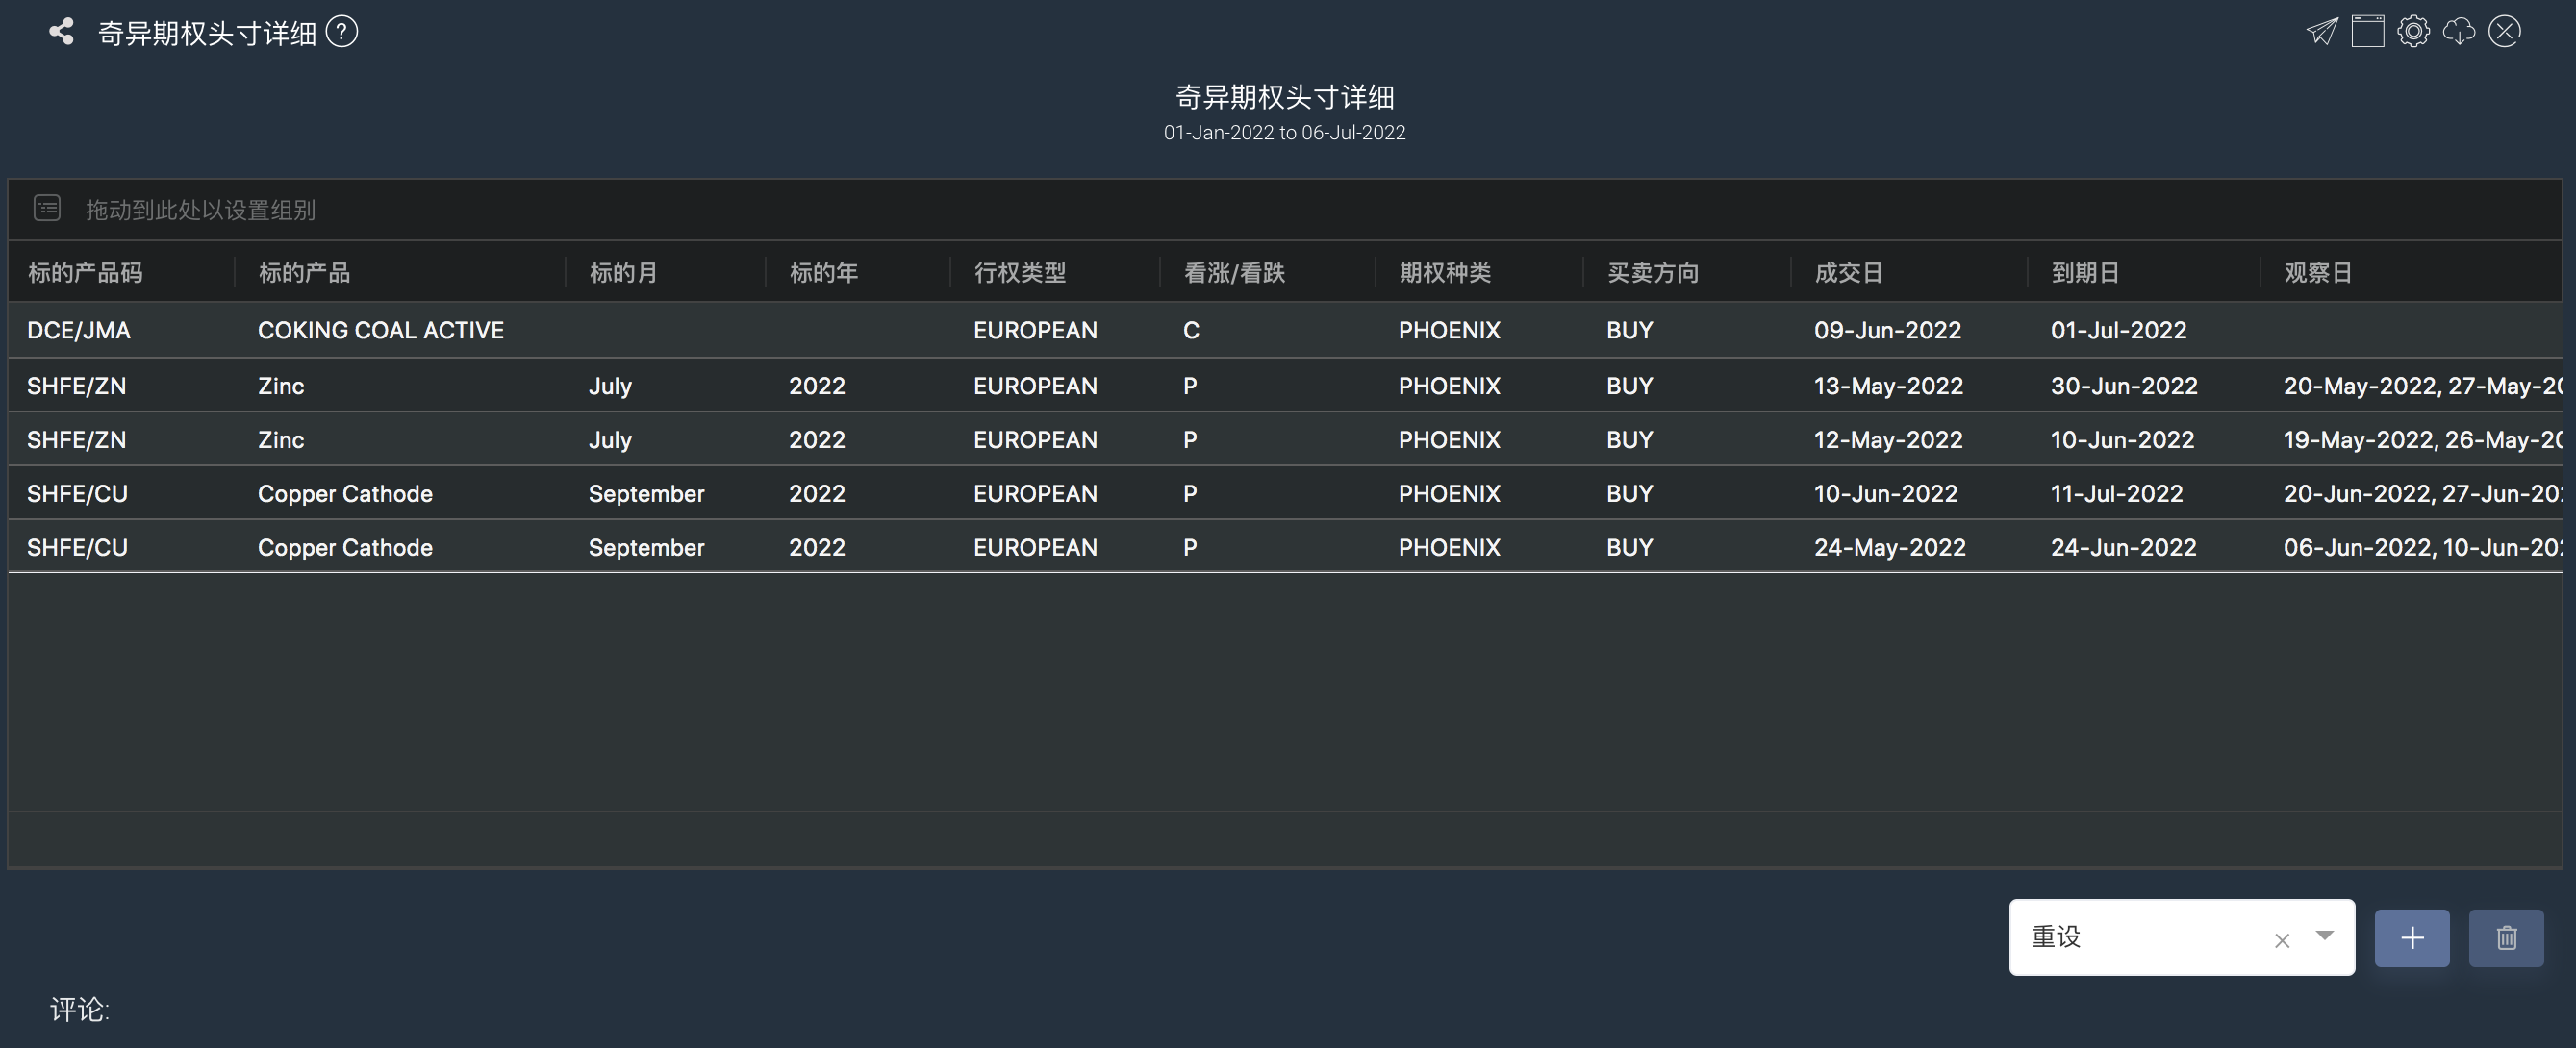
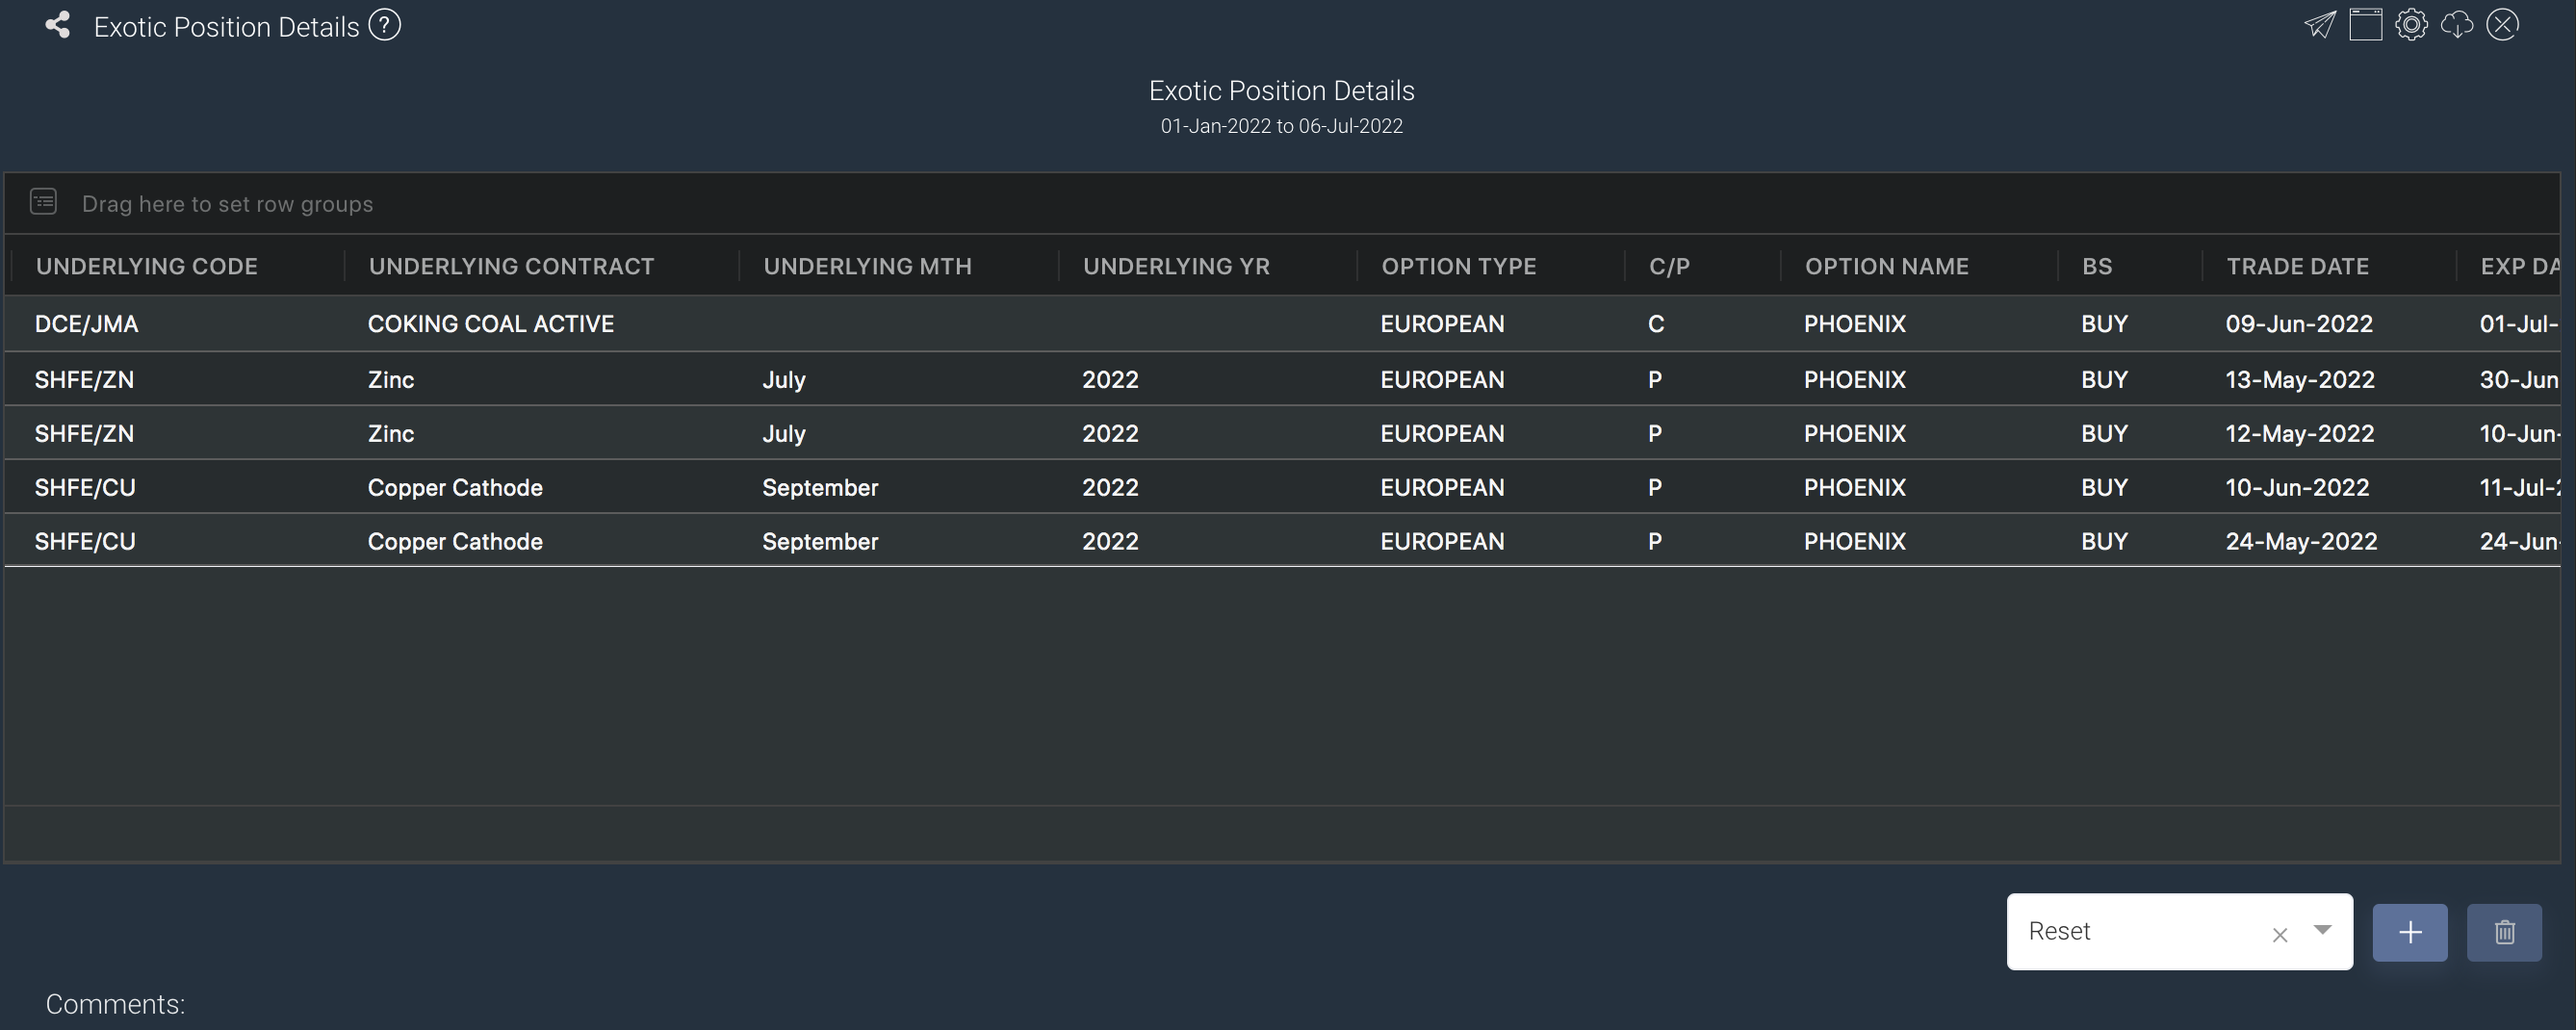
The Exotic Position Details model provides a summary of your exotic trades' account details comprising of various data as follows:
| Column Name | Type | Details | Group Summary Row |
|---|---|---|---|
MARGIN 保证金 | Number, futures amount decimal | input in IM in Portfolio>General Ledger>FCM Statement | y |
MARGIN EXCESS/DEFICIT | Number, futures amount decimal | Auto calculate based on inputs in Portfolio>General Ledger>FCM Statement | y |
TOTAL EQUITY 总资金 | Number, futures amount decimal | input in Portfolio>General Ledger>FCM Statement | y |
CREDIT | input in Portfolio>General Ledger>FCM Statement | y | |
TOTAL EQUITY (INCLUDING CREDIT) 总权益(含授信) | Number, futures amount decimal | Total Equity + Credit | y |
MARGIN RATIO % 保证金占用率 % | Value * 100, Number, no limit to decimal | ||
CUM REALIZED P/L 平仓盈亏 | Number, futures amount decimal | Realised P/L, input in Portfolio>General Ledger>FCM Statement | y |
FUND IN/OUT 出入金 | Number, futures amount decimal | input in Portfolio>General Ledger | y |
STMT TOTAL P/L 总盈亏 | Number, futures amount decimal | Total Equity - Fund In/Out | y |
SYS TOTAL P/L 权益总计 | Number, futures amount decimal | Cum Realised P/L + Fund In/Out | y |
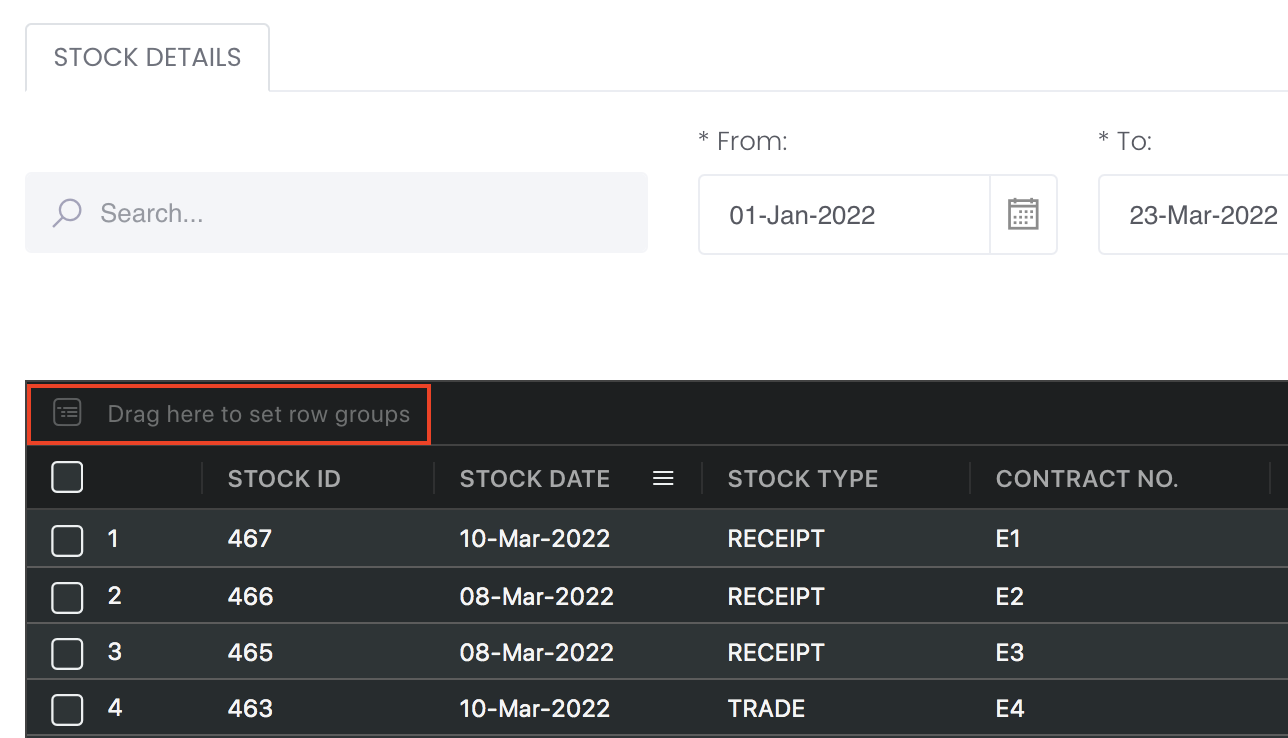
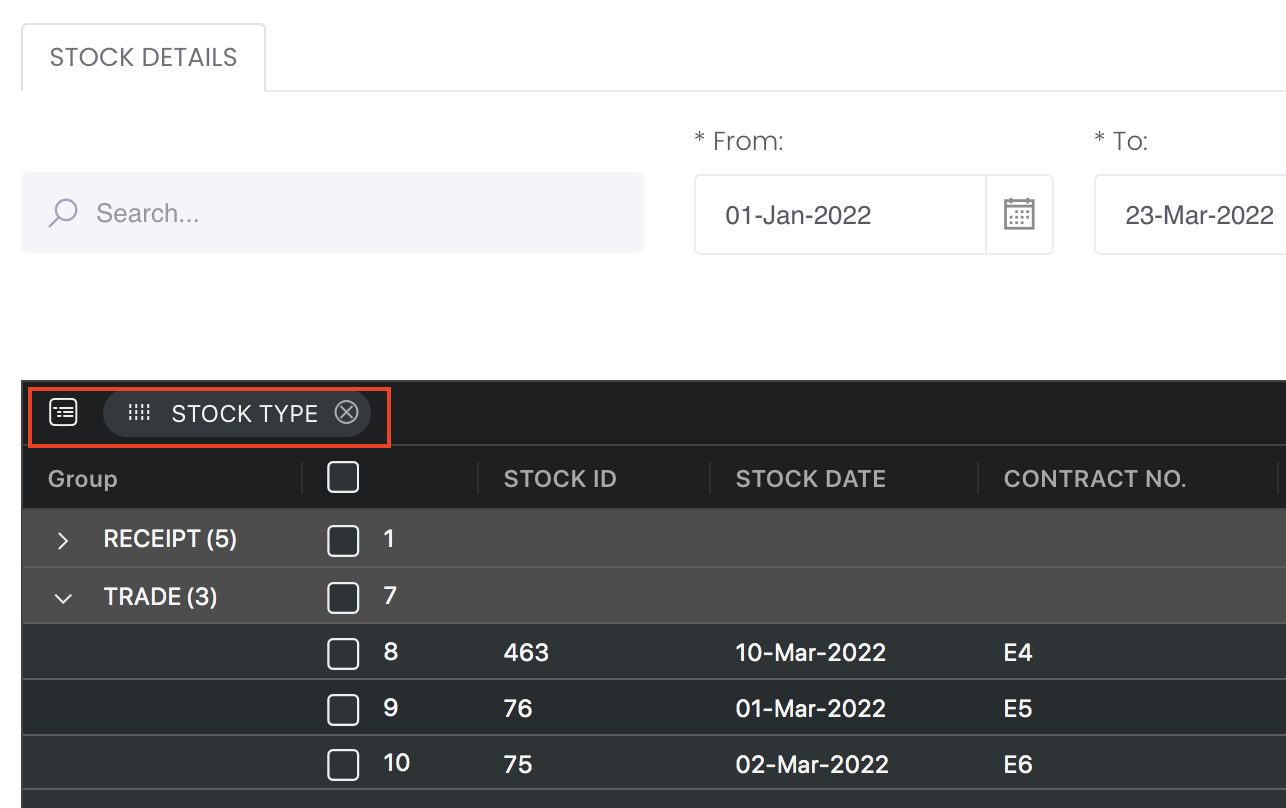
To categorise the trades according to your needs, you can reorganise your data by dragging-and-dropping the columns at the top of the table to 'set row groups'. Columns like Total Equity etc will be summed up accordingly.
Navigation
To access the quantitative model/report, click on 'Dashboard' from the navigation sidebar on the left.
Select the model/report from the drop-down list and click 'Create'. Click on the 'Settings' button (gear icon) at the top right corner of the model to set up your model/report.
Sharing Model/Report/Dashboard
To share the model with your group members, click on the "Share" button next to the Title of the model followed by the email address of the group members you want to share it with. Once submitted, the model will appear in the Dashboard>Group Dashboard of the selected group members.
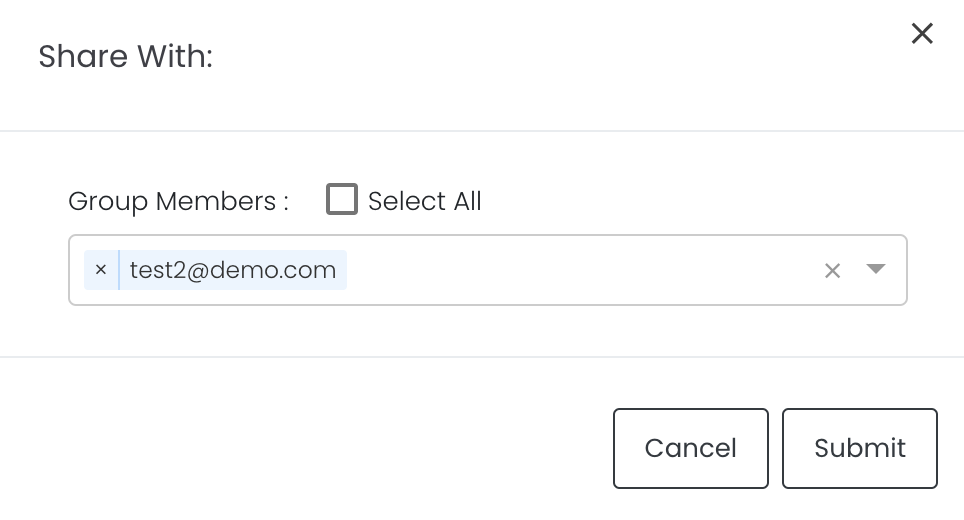
This is different from sharing individual or entire Dashboard models/reports, which allows any user who may or may not be users of MAF Cloud to access the individual model/entire dashboard via the shared web link (link will expire in 8 hours). In Group Dashboard, only group members can access the shared models/reports.
Group Rows
You may also group the rows (liken to the pivot table function in Microsoft Excel) to view the grouped data by dragging any column headers into the “row groups” section as highlighted:
Guide
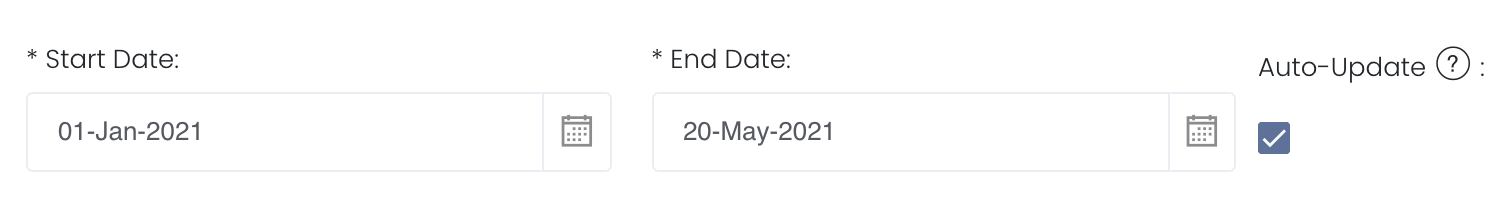
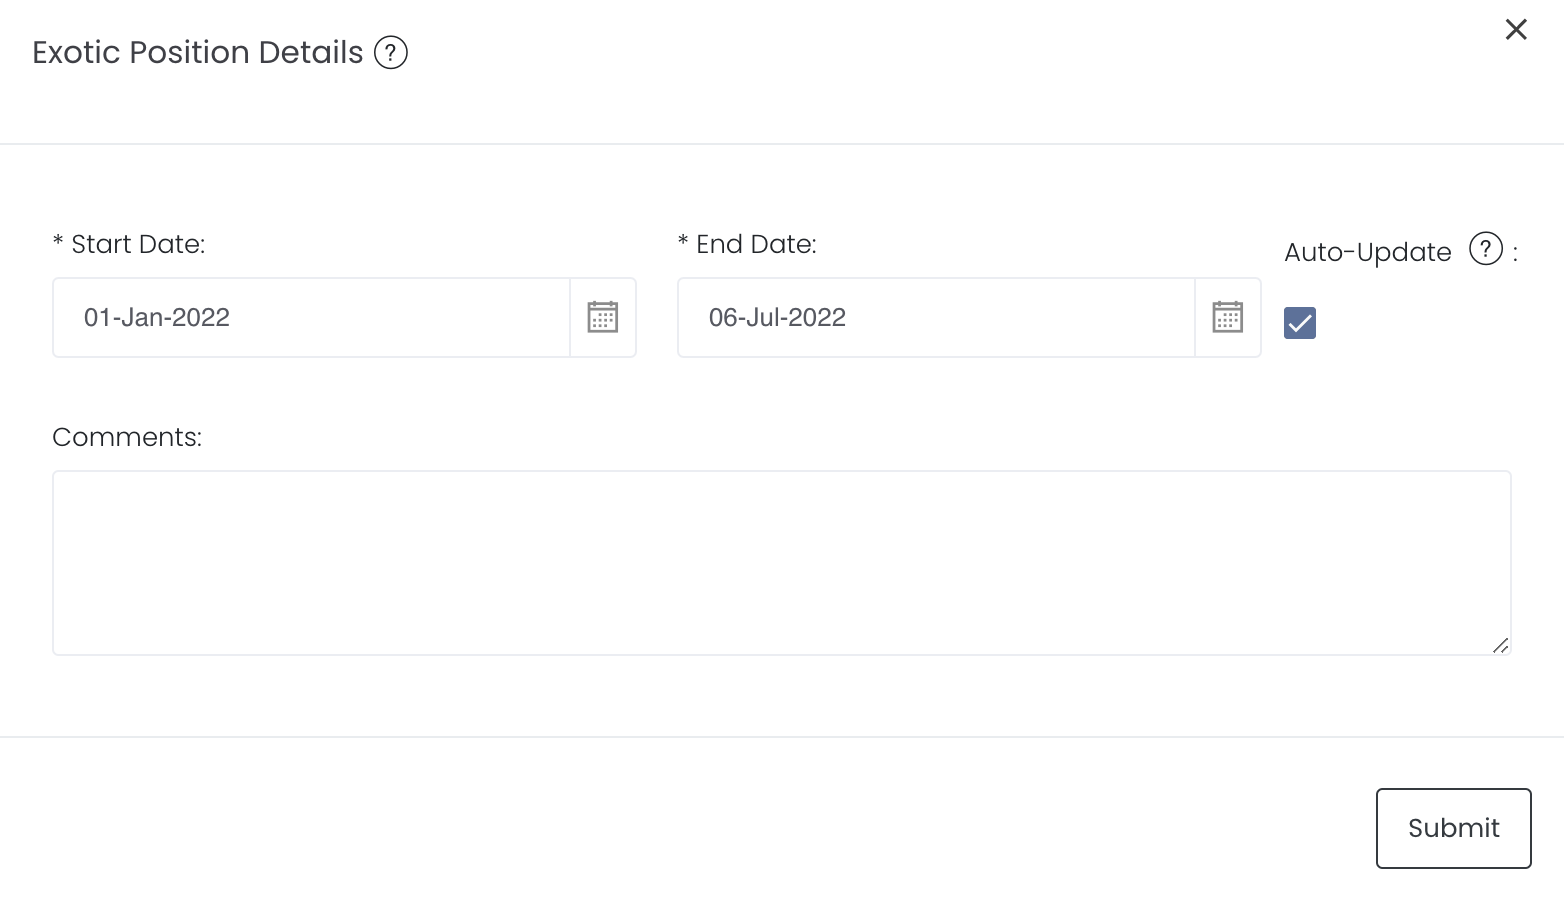
Duration |
Select the end date to determine the range of period and cut-off date for the calculations of P/L. End Date will be yesterday's date by default. End Date cannot be today's date. You are free to edit the dates as necessary. Auto-Update Tick: Resets the dates to default once you leave the ‘Dashboard’ page. Untick: Dates according to your settings remain unchanged once you leave the ‘Dashboard’ page. |
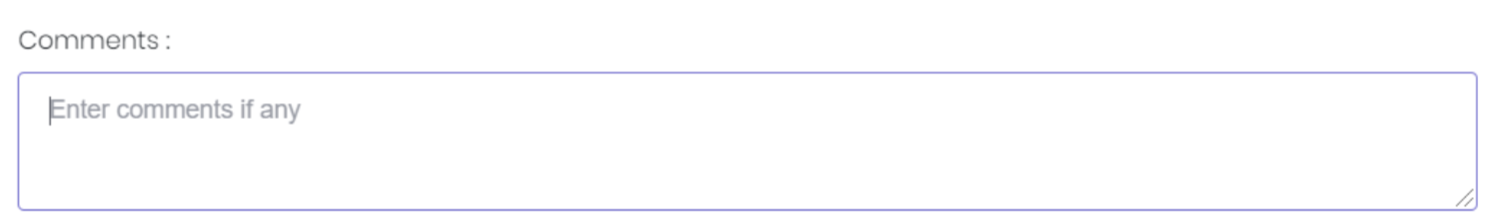
Comments |
The inserted comments will be displayed at the bottom of the application. This can be useful for documentation purposes or for settings description. |
Input
Name | Description | Type | Example |
|---|---|---|---|
| End Date | End of product time-series. | Date (YYYY-MM-DD) | 2019-06-14 |
| Auto Update | Tick: Resets the dates to default once you leave the ‘Dashboard’ page. Untick: Dates according to your settings remain unchanged once you leave the ‘Dashboard’ page. | Checkbox | - |
| Comments | Useful for documentation purposes or for settings description. | Text | - |
Output
Description | Type | |
|---|---|---|
Product/Strategy Information | Provides an overview of all the open positions in your portfolio. You can reorganise your data by dragging-and-dropping the columns at the top of the table to 'set row groups'. | Text |
Example
Functionality
Please refer to Table Settings for table functionalities.
Definition of Terms
Please refer to List of Definitions: Trades.
Click to access: