Fund NAV Report
- IT Support
Return to Overview
About
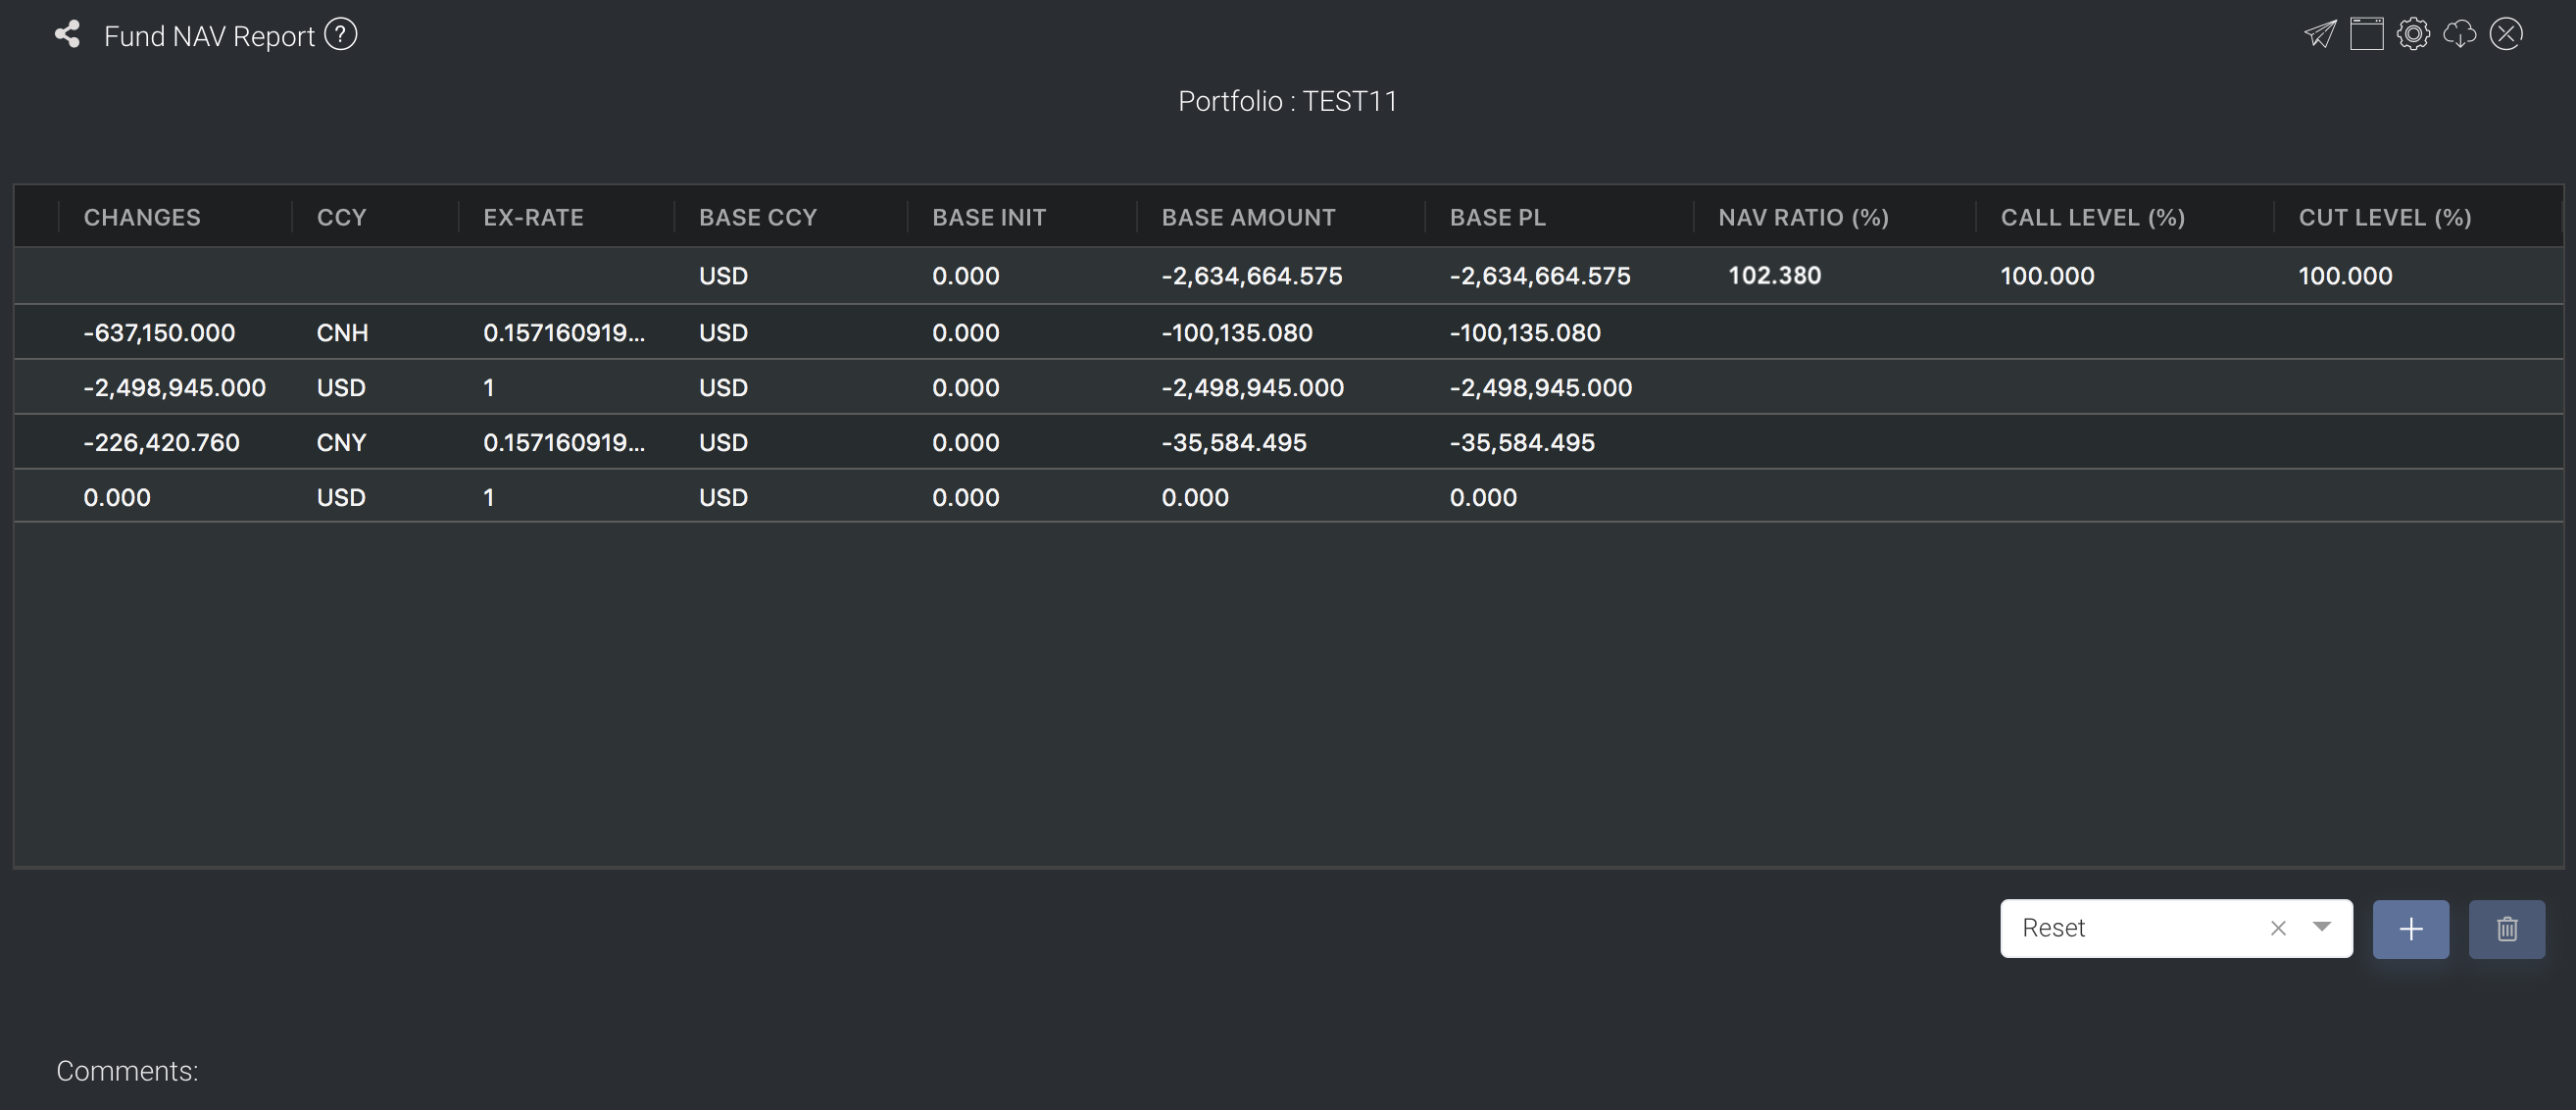
Fund Net Asset Value (NAV) Report is used to determine the performance of your funds based on base amount, P/L, NAV ratio and predetermined call/cut levels. You may upload your paper trades as per normal via Creating New Paper Trade(s) and the model will calculate the figures accordingly. You may also input the Call and Cut Level to determine if your NAV Ratio requires immediate attention.
You can click here to learn how to customise the table by arranging and filtering the columns based on your preference, and saving the table layout(s) as a template.
Navigation
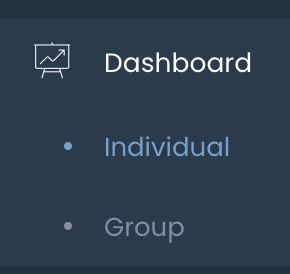
To access the quantitative model/report, click on 'Dashboard' from the navigation sidebar on the left.
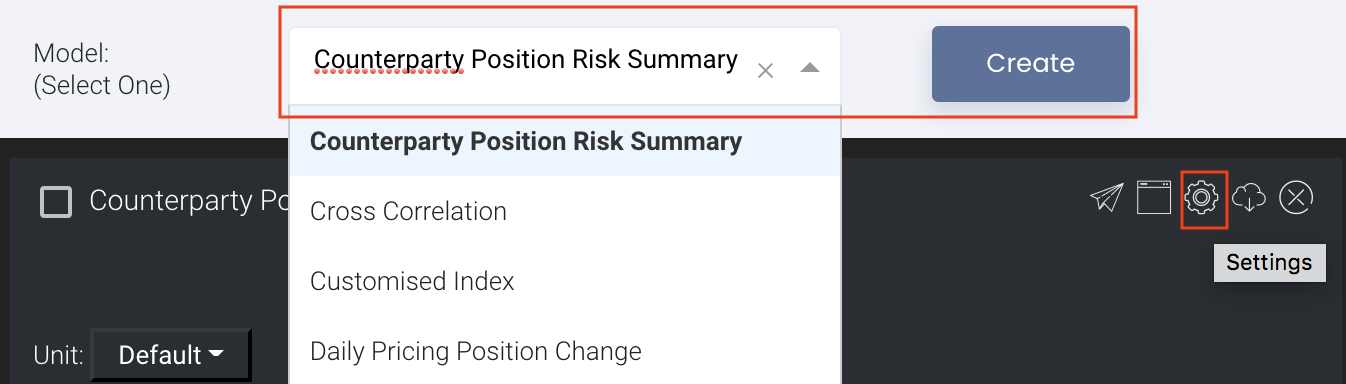
Select the model/report from the drop-down list and click 'Create'. Click on the 'Settings' button (gear icon) at the top right corner of the model to set up your model/report.
Sharing Model/Report/Dashboard
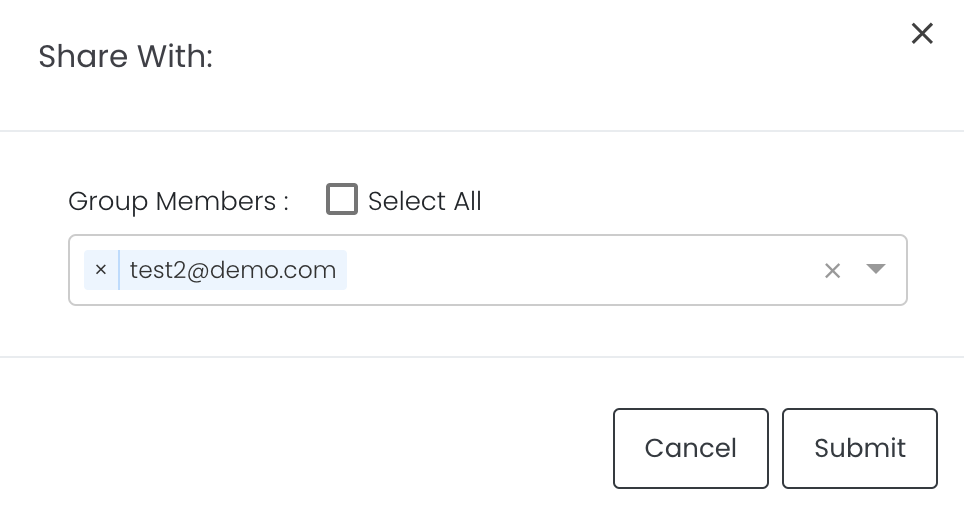
To share the model with your group members, click on the "Share" button next to the Title of the model followed by the email address of the group members you want to share it with. Once submitted, the model will appear in the Dashboard>Group Dashboard of the selected group members.
This is different from sharing individual or entire Dashboard models/reports, which allows any user who may or may not be users of MAF Cloud to access the individual model/entire dashboard via the shared web link (link will expire in 8 hours). In Group Dashboard, only group members can access the shared models/reports.
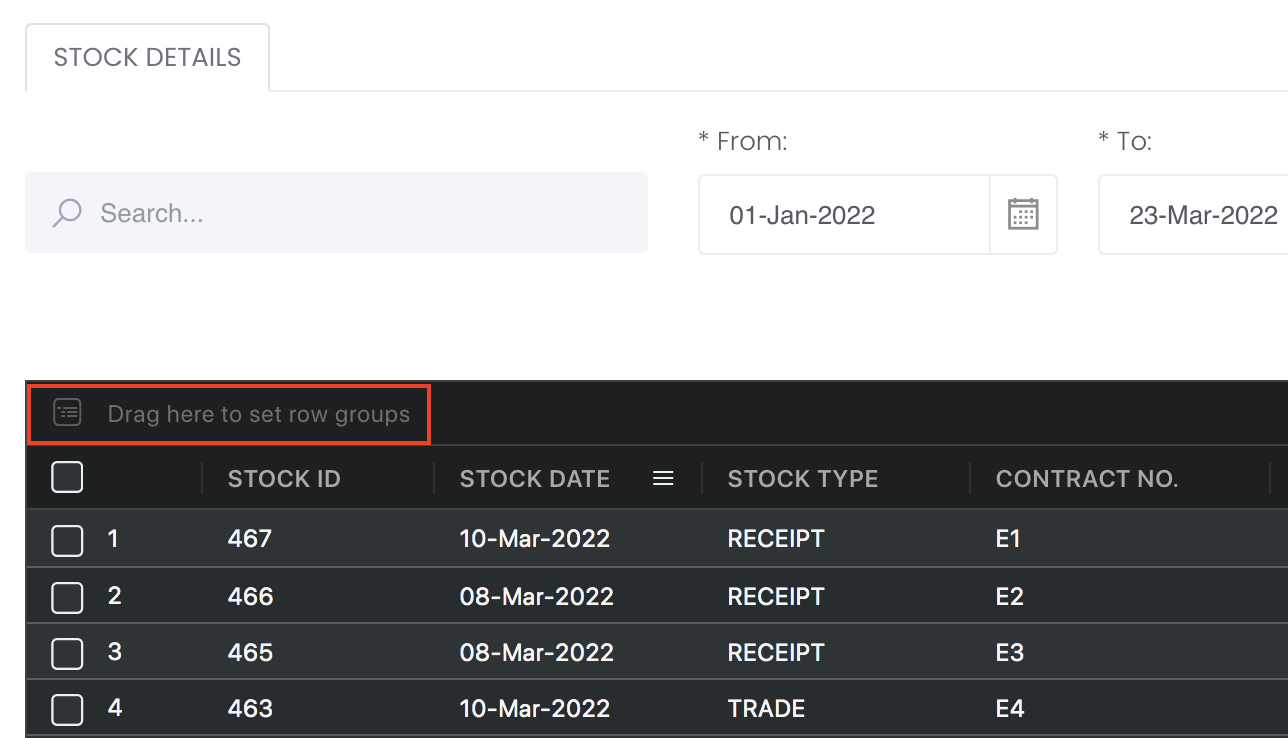
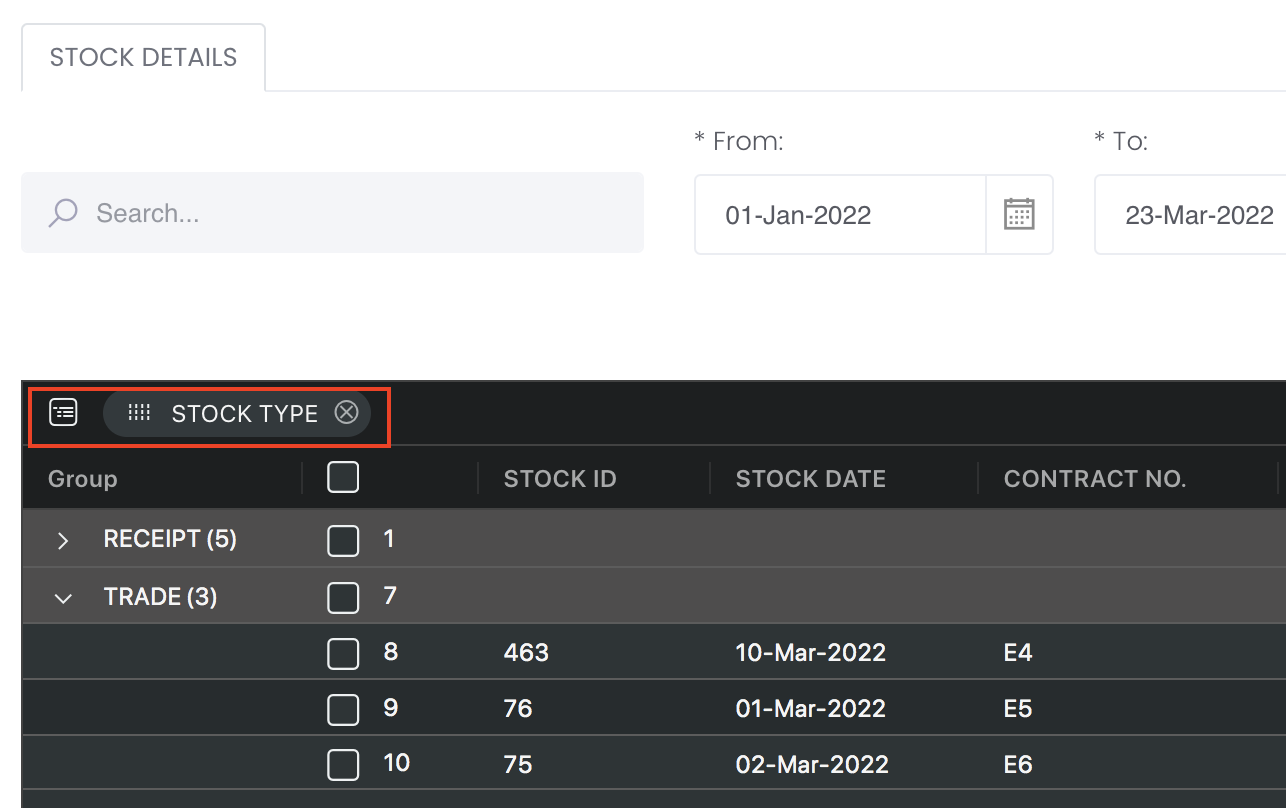
Group Rows
You may also group the rows (liken to the pivot table function in Microsoft Excel) to view the grouped data by dragging any column headers into the “row groups” section as highlighted:
Guide
Name | Images/Description |
|---|---|
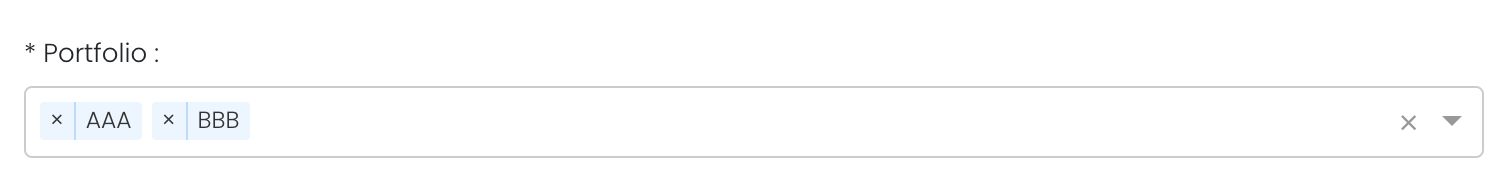
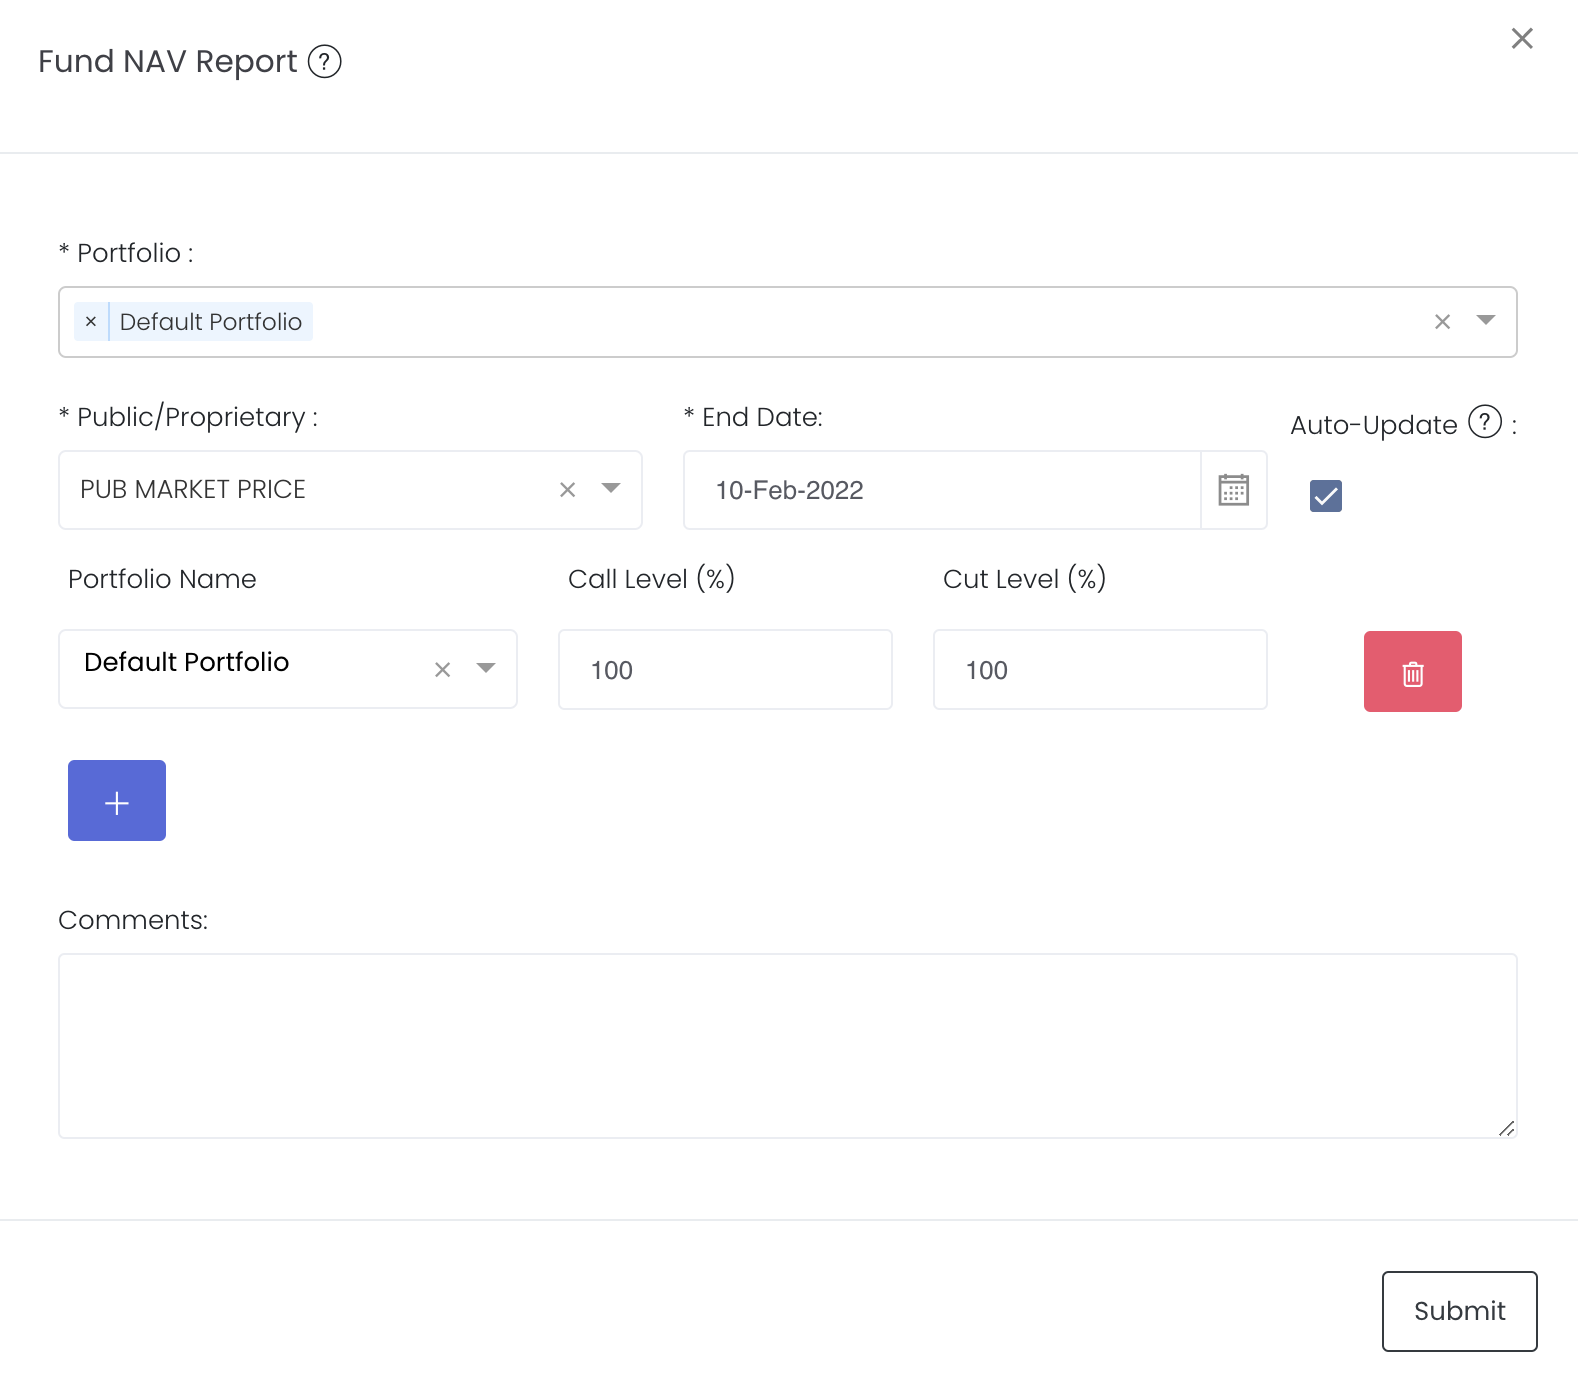
Portfolio |
Select a portfolio of interest. You may select multiple portfolios to be displayed in the model. |
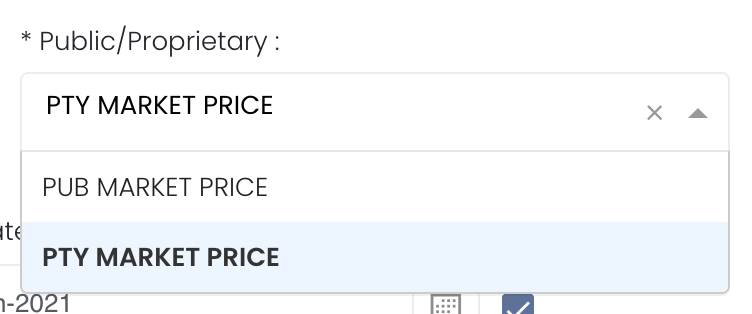
| Public/Proprietary |
Select public market data or proprietary market data to determine the market data prices used to calculate the P/L or positions accordingly. Please note that if the proprietary (private) market data for certain dates are not input here eg 1 May to 10 May price is input but not 9 May, when you select private data when viewing the portfolio and using the models in Dashboard (eg for trades with trade date on 9 May but private data is not available), the system will use the latest date's settlement price (10 May) to perform the calculations. |
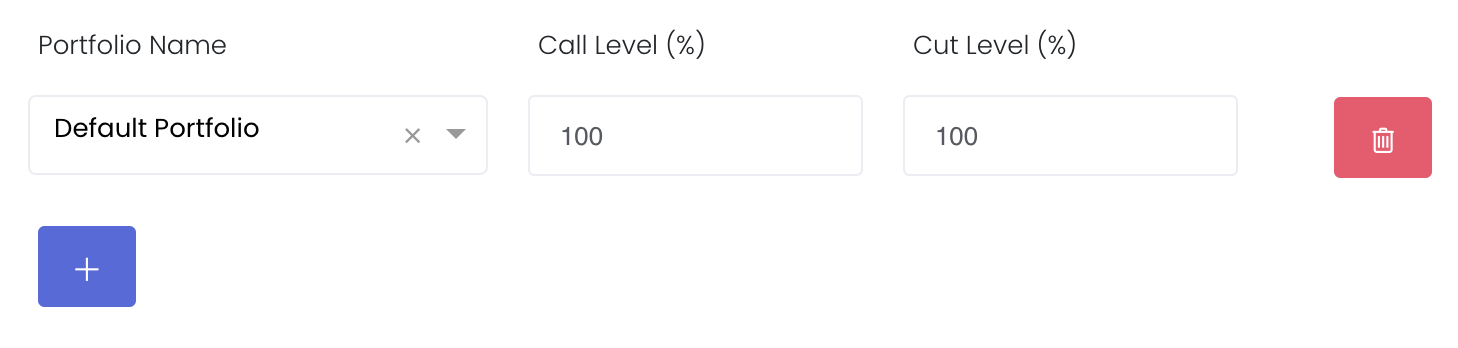
Call and Cut Level (%) | Input Call and Cut Level (%) Click on the blue "+" button and select the portfolio name and input the Call and Cut level (%). Call Level: Cut Level: To remove the function, click on the red bin button on the right to remove it and Call and Cut level will remain as empty in the model displayed.
|
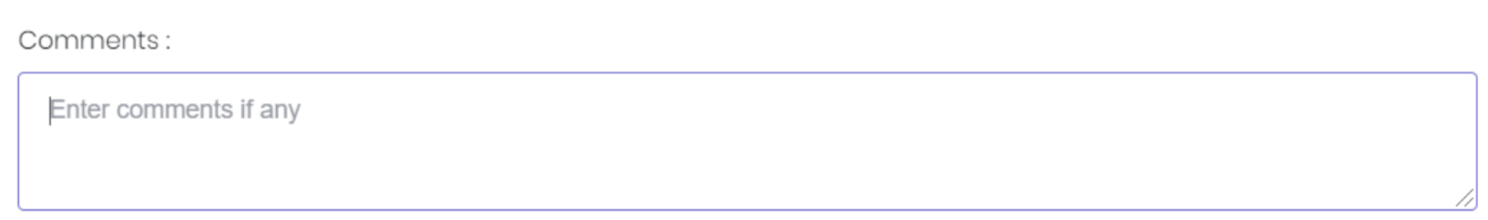
Comments |
The inserted comments will be displayed at the bottom of the application. This can be useful for documentation purposes or for settings description. |
Input
Name | Description | Type | Example |
|---|---|---|---|
| Portfolio | Portfolio selected. | Portfolio (Selection) | ABC |
| Start Date | Start of product time-series. | Date (YYYY-MM-DD) | 2015-06-01 |
| End Date | End of product time-series. | Date (YYYY-MM-DD) | 2019-06-14 |
| Auto Update | Tick: Resets the dates to default once you leave the ‘Dashboard’ page. Untick: Dates according to your settings remain unchanged once you leave the ‘Dashboard’ page. | Checkbox | - |
| Comments | Useful for documentation purposes or for settings description. | Text | - |
Output
Description | Type | |
|---|---|---|
Product/Strategy Information | You can reorganise your data by dragging-and-dropping the columns at the top of the table to 'set row groups'. | Text |
Example
Functionality
Please refer to Table Settings for table functionalities.
Definition of Terms
Please refer to List of Definitions: Trades.
Click to access: