U.S. Recession Prediction Model
- Christabel Chiang (Unlicensed)
- IT Support
- MAF Intern (Unlicensed)
Return to Overview
About
Yield curve inversion is often regarded by investors as a leading indicator of likely recessions. In this model, the likelihood of a U.S. recession is estimated by the U.S. yield curve spread (difference in yields between the U.S. 10-year Treasury Note and the U.S. 3-Month Treasury Bill) using a probit model. Drawing on data of past probabilities that are based on the U.S. yield curve spread, each yield curve spread has fitted a probability of predicting a recession in the next 12 months. Users can view historical data of U.S. yield curve spreads and their corresponding predicted likelihood of recession, each as a time-series.
Navigation
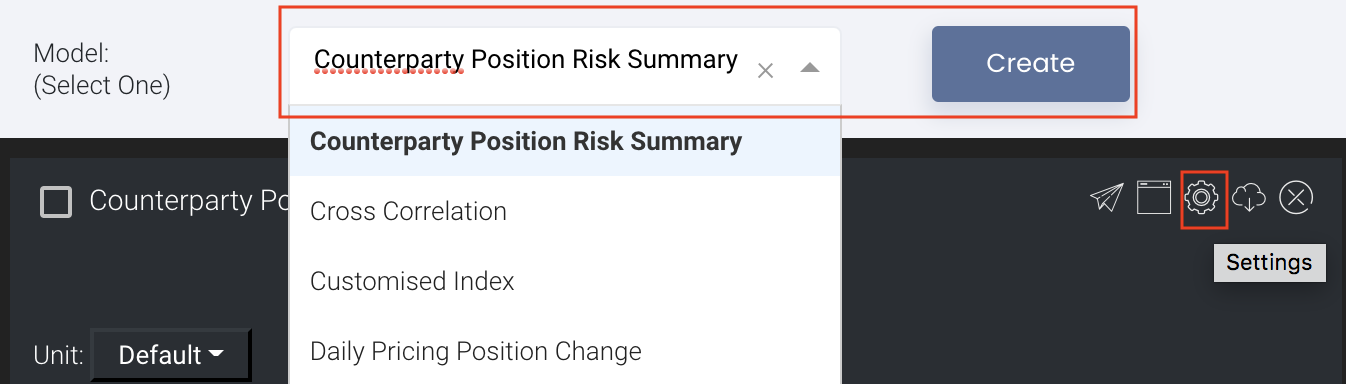
To access the quantitative model/report, click on 'Dashboard' from the navigation sidebar on the left.

Select the model/report from the drop-down list and click 'Create'. Click on the 'Settings' button (gear icon) at the top right corner of the model to set up your model/report.
Sharing Model/Report/Dashboard
To share the model with your group members, click on the "Share" button next to the Title of the model followed by the email address of the group members you want to share it with. Once submitted, the model will appear in the Dashboard>Group Dashboard of the selected group members.

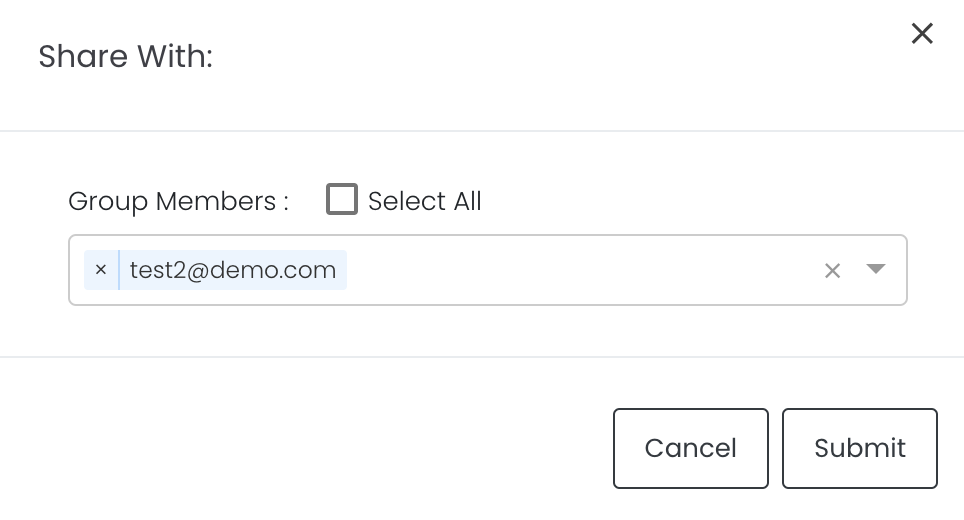
This is different from sharing individual or entire Dashboard models/reports, which allows any user who may or may not be users of MAF Cloud to access the individual model/entire dashboard via the shared web link (link will expire in 8 hours). In Group Dashboard, only group members can access the shared models/reports.
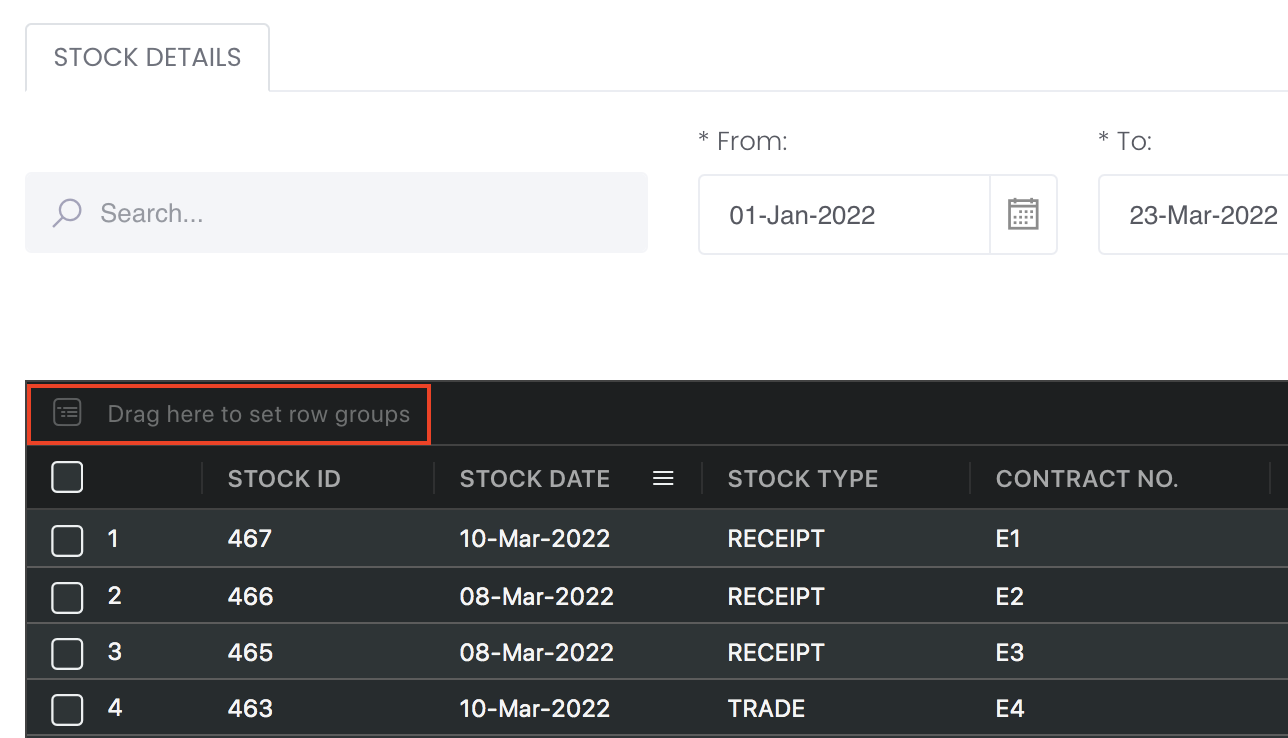
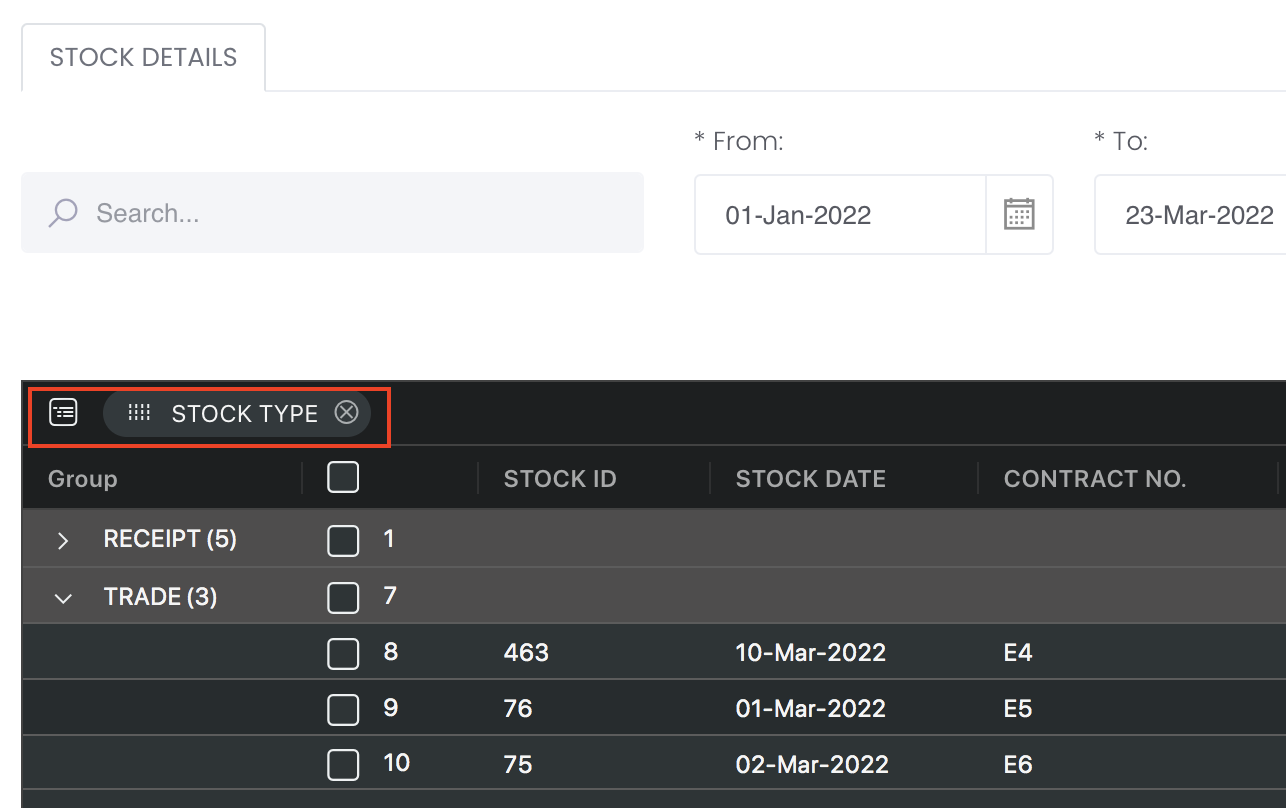
Group Rows
You may also group the rows (liken to the pivot table function in Microsoft Excel) to view the grouped data by dragging any column headers into the “row groups” section as highlighted:
Guide
| Name | Image/Description |
|---|---|
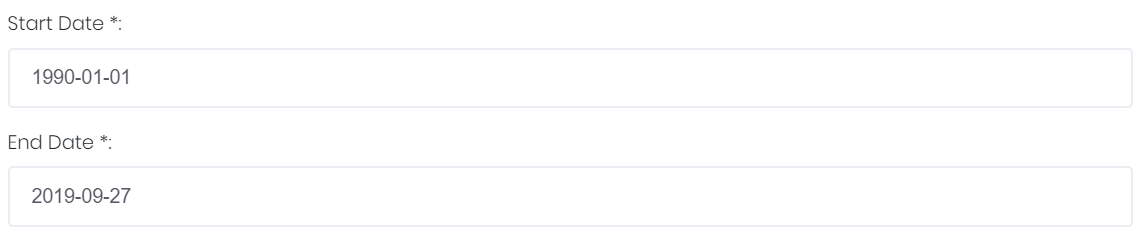
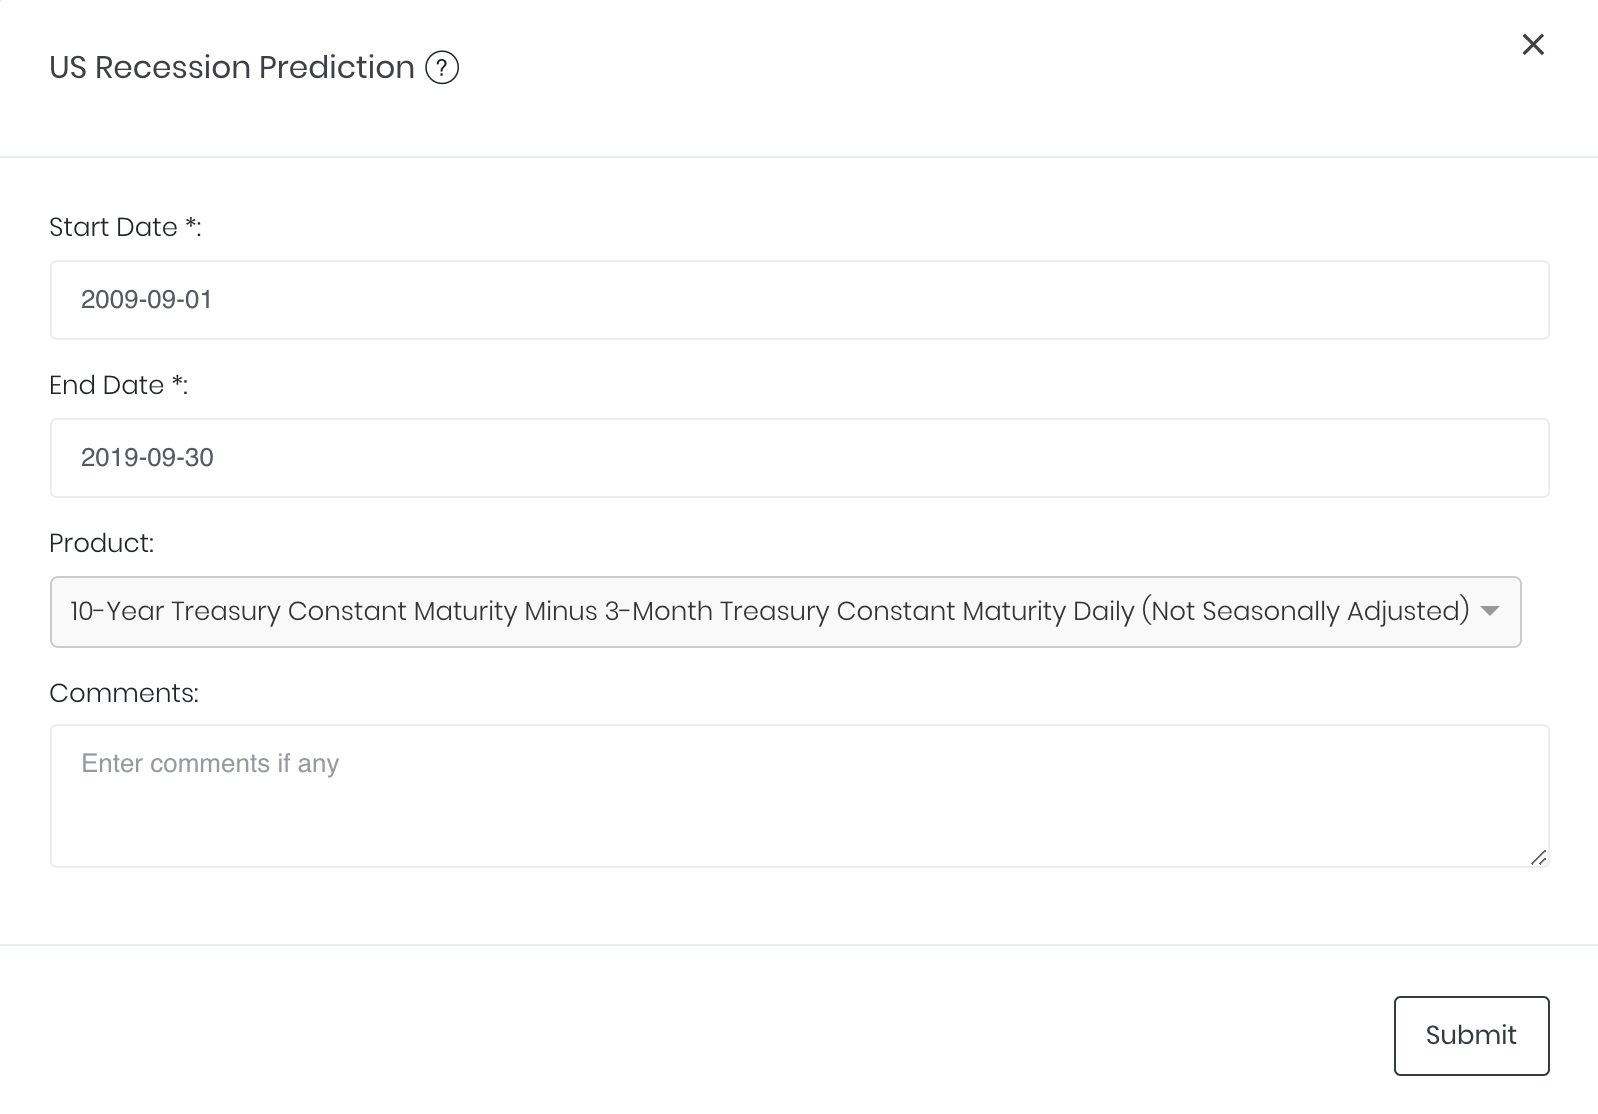
| Duration |
Select the start and end date for the period of analysis. |
| Product(s) |
The product used for analysis is "10-Year Treasury Constant Maturity Minus 3-Month Treasury Constant Maturity Daily (Not Seasonally Adjusted)" from FRED (Code: T10Y3M). It cannot be changed by the user. |
| Comments |
The inserted comments will be displayed at the bottom of the application. This can be useful for documentation purposes or for settings description. |


Input
| Name | Description | Type | Example |
|---|---|---|---|
| Start Date | Start date of analysis. | Date (YYYY-MM-DD) | 2009-09-01 |
| End Date | End date of analysis. | Date (YYYY-MM-DD) | 2019-09-30 |
| Comments | Useful for documentation purposes or for settings description. | Text | - |
Output
| Name | Description | Type |
|---|---|---|
| Recession Probability % | Shown as a time-series in green. Its unit range is shown on the left Y-axis. | Plot |
| Value of Spread % | Shown as a time-series in blue. Its unit range is shown on the right Y-axis. | Plot |
| Summary | Shown at the top of both Y-axes are some significant values ('Value'): Under 'Value of Spread %': Yield curve spread (FRED-T10Y3M) on the latest available date. Under 'Recession Probability %': Probability of recession within the next 12 months (date of projection is shown). | Numerical Value |
Example
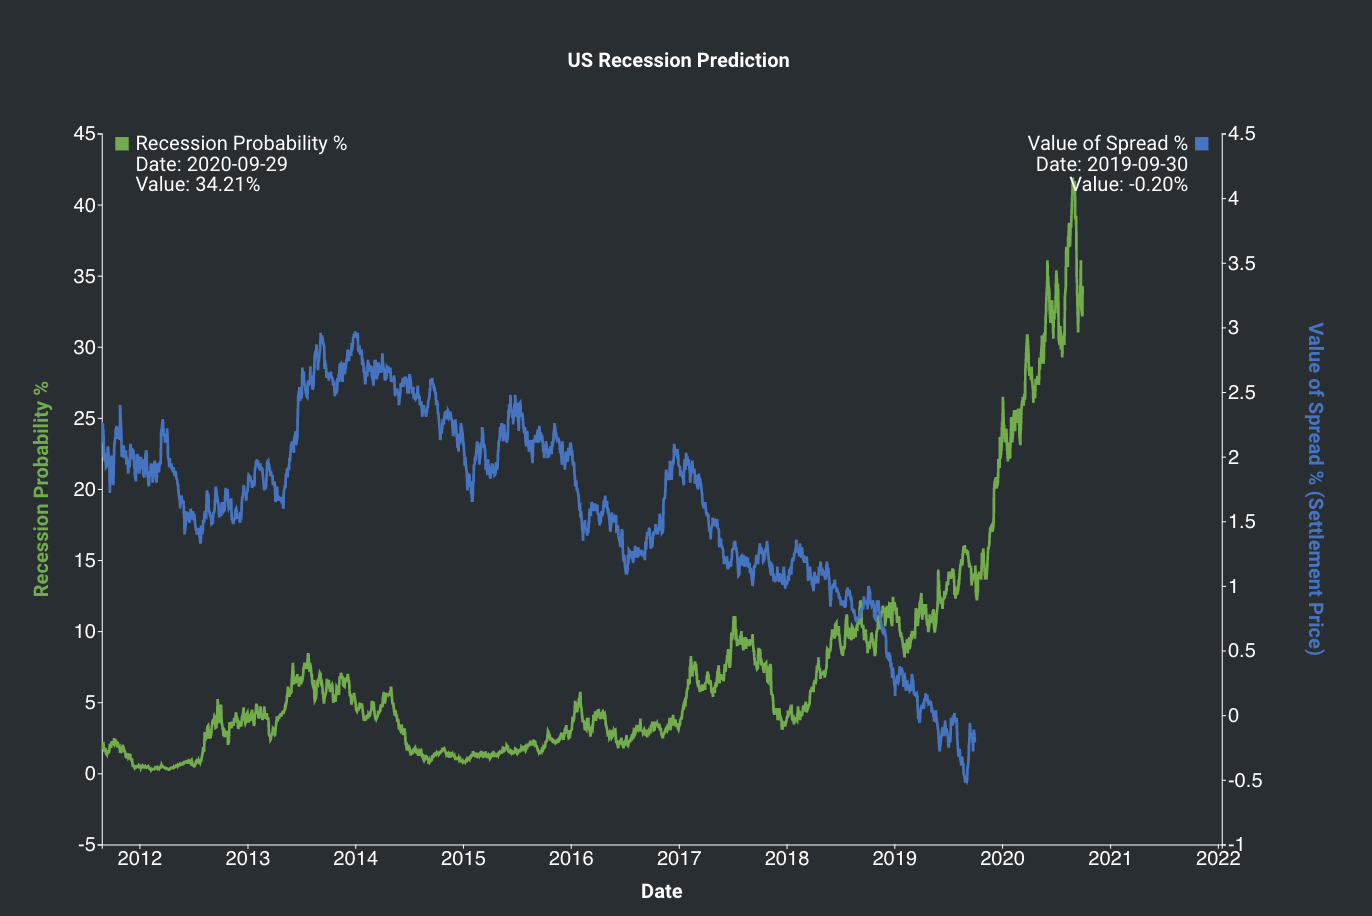
As of 2019-09-30, the U.S. yield curve spread is -0.20% (indicating an inverted yield curve), and the estimated probability of a recession in the next 12 months is 34.21%. So, is a recession coming?
Real-World Examples using the U.S. Recession Prediction Model:
Functionality
Displayed below are some noteworthy user interactions you can find on this application.
| Name | Description | Interaction |
|---|---|---|
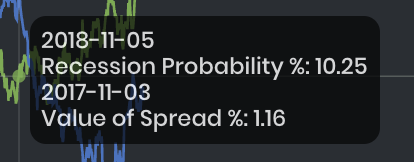
| Multi Tooltip Lines (Vertical and Horizontal) | Mouse-over the graph and circle(s) will appear on the various time-series point(s) with a tooltip that displays the X-axis value ('Date') along with the values on the Y-axis ('Recession Probability %' and 'Value of Spread %'). The date for which recession prediction is made ('RP Date') is 12 months ahead of the date for which the yield curve spread is taken ('VOS Date').
| Plot Element |
Click to access: