Group P/L
- IT Support
- MAF Intern (Unlicensed)
Return to Overview
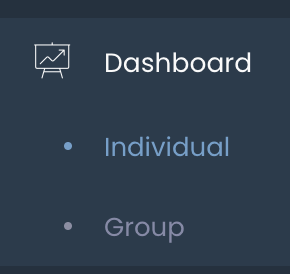
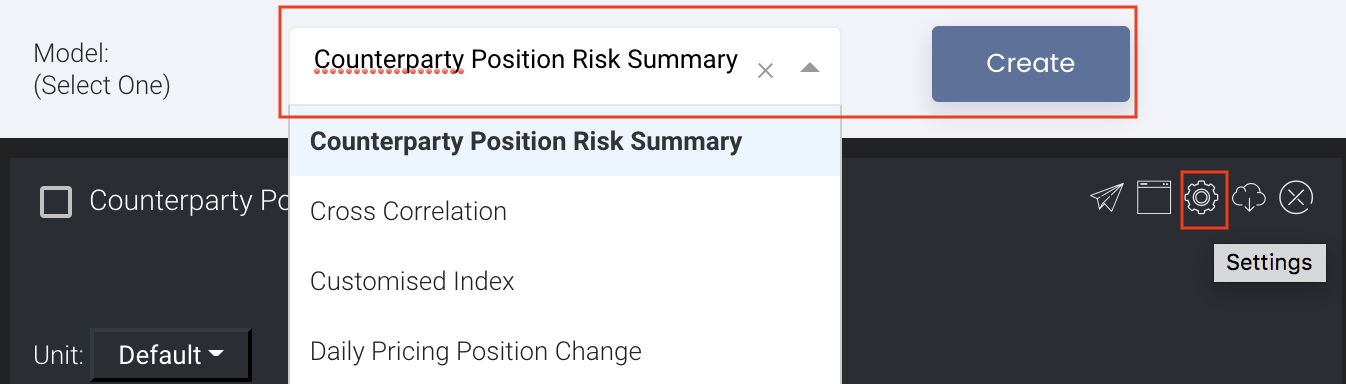
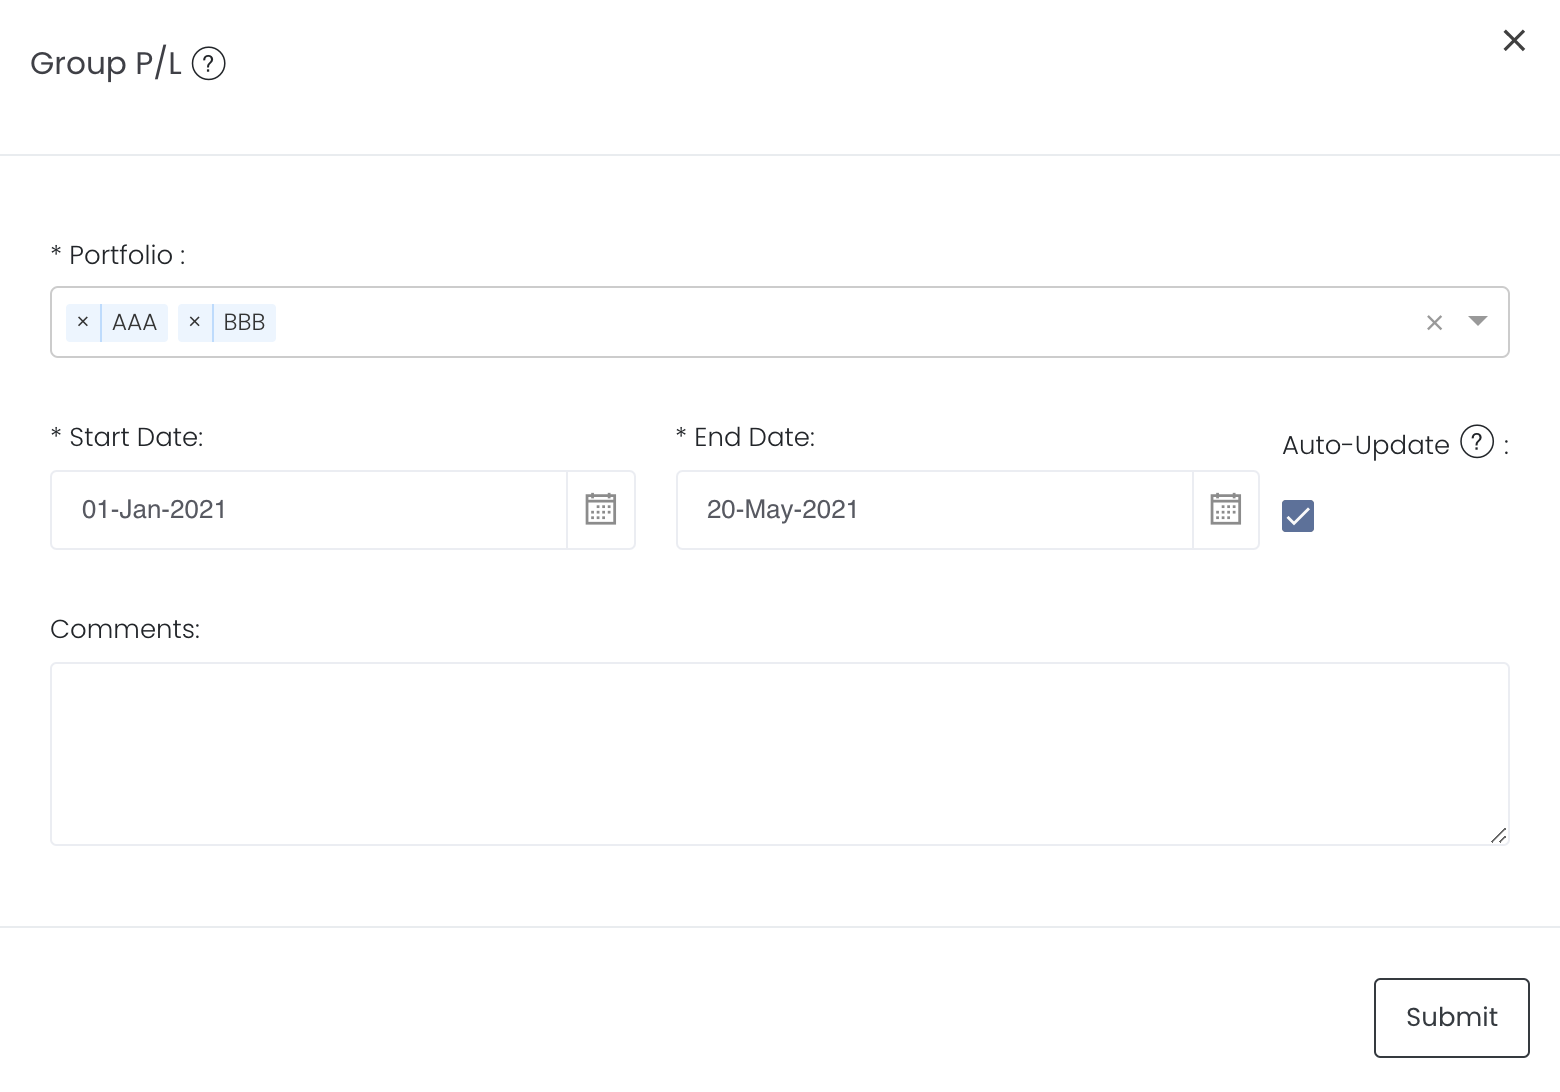
To access the quantitative model/report, click on 'Dashboard' from the navigation sidebar on the left. Select the model/report from the drop-down list and click 'Create'. Click on the 'Settings' button (gear icon) at the top right corner of the model to set up your model/report.
About
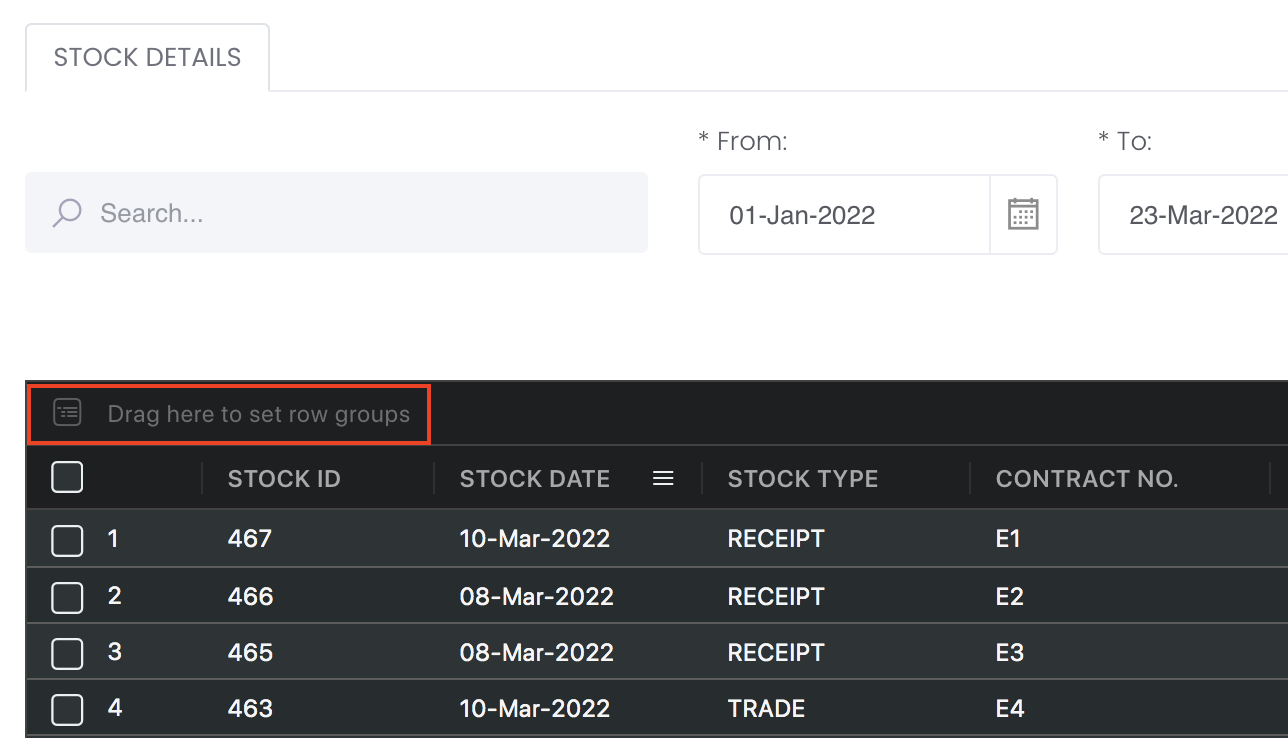
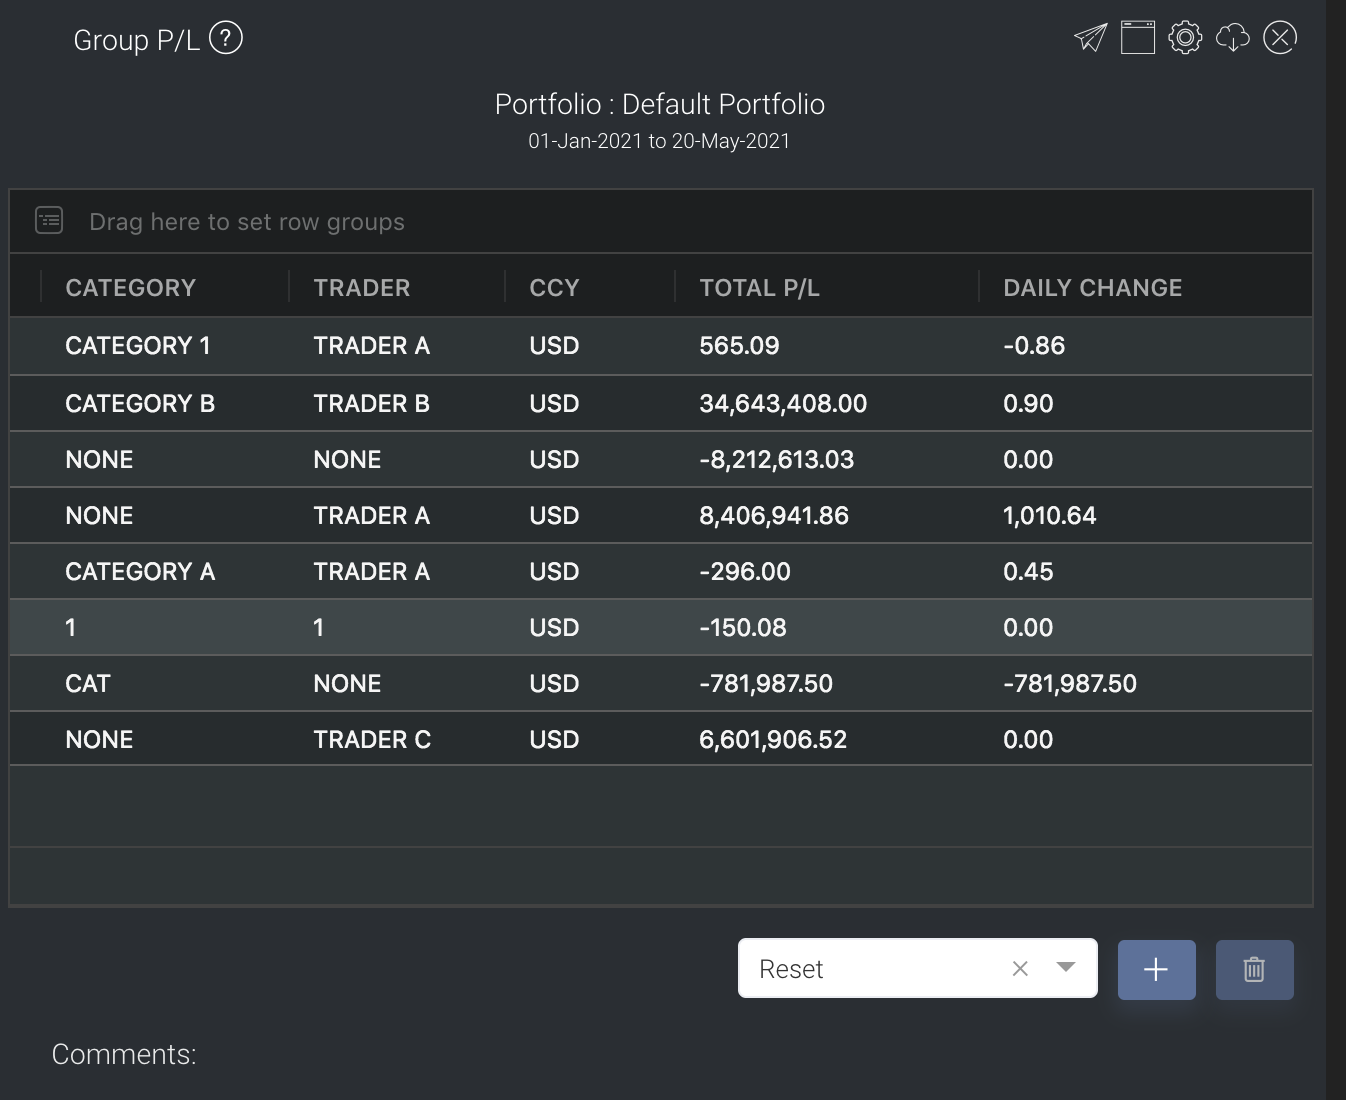
The Group P/L model provides an overview of all trades and their total P/L, with daily change in P/L, commission and expenses/income details displayed for your convenience. To categorise the trades according to your needs, you can reorganise your data by dragging-and-dropping the columns at the top of the table to 'set row groups'. Columns like daily change in P/L, commission and expenses/income will be summed up accordingly.
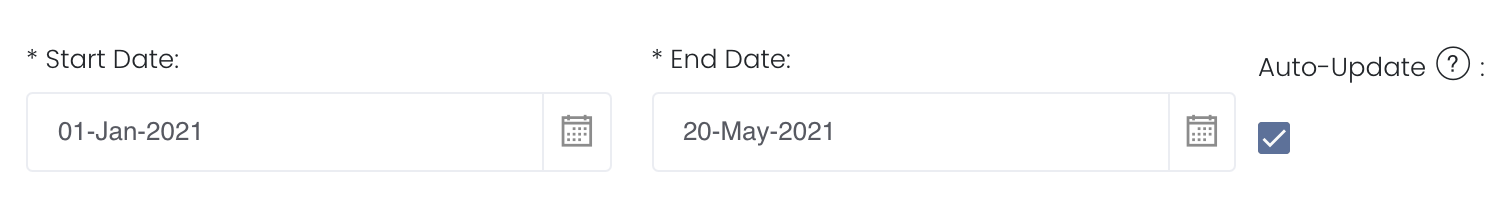
The 'Start Date' will be 1st day of the year (1 Jan 2021) by default and 'End Date' will be today's date by default. You can select the cut-off date ('End Date') to determine your P/L for that period and the close/settlement date of each trade is crucial as it will determine which month/year's P/L it will belong to.
The rows are the various categories of assets in the portfolio while the columns indicate product information such as portfolio name, trader and total P/L. The table acts like a pivot table and can be categorised and organised by groups according to your needs. You can click here to learn how to customise the table by arranging and filtering the columns based on your preference, and saving the table layout(s) as a template. Also see Futures Contracts Codes for more information on exchange and month codes, if required.
Note: For expense/income items to appear in the expense/income column, you will be required to select the contract number to be linked to the specific expense/income item in the expense/income table.
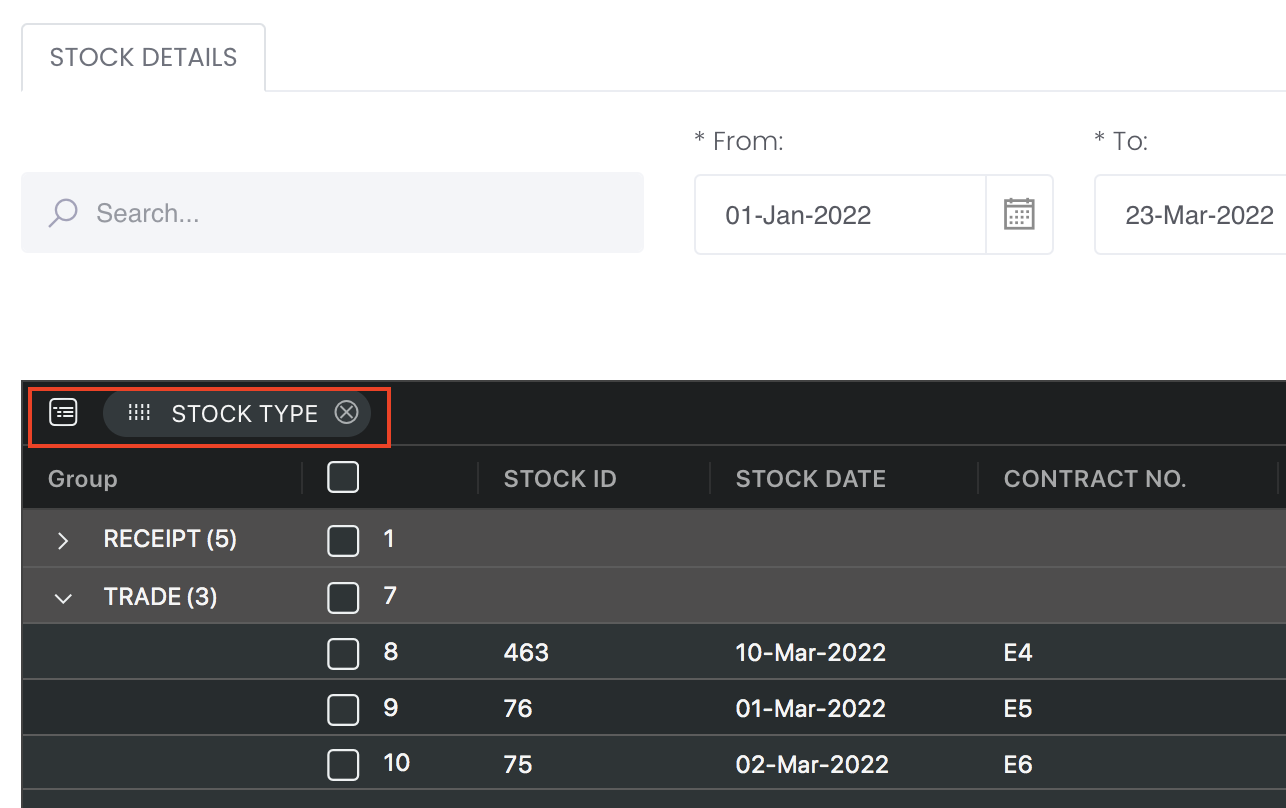
When you group any header rows, and click on "Save", a successful pop up message will appear and the header row remains in the grouped row.
Navigation
To access the quantitative model/report, click on 'Dashboard' from the navigation sidebar on the left.
Select the model/report from the drop-down list and click 'Create'. Click on the 'Settings' button (gear icon) at the top right corner of the model to set up your model/report.
Sharing Model/Report/Dashboard
To share the model with your group members, click on the "Share" button next to the Title of the model followed by the email address of the group members you want to share it with. Once submitted, the model will appear in the Dashboard>Group Dashboard of the selected group members.
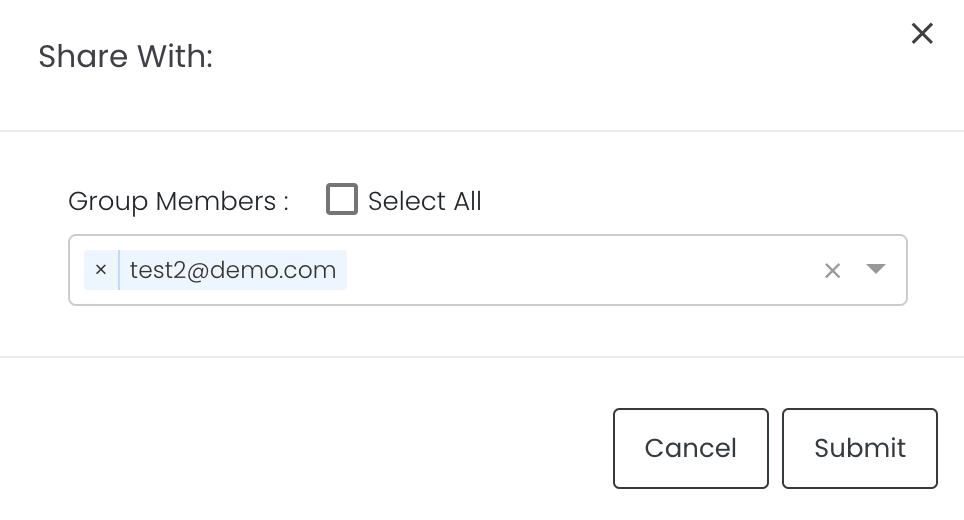
This is different from sharing individual or entire Dashboard models/reports, which allows any user who may or may not be users of MAF Cloud to access the individual model/entire dashboard via the shared web link (link will expire in 8 hours). In Group Dashboard, only group members can access the shared models/reports.
Group Rows
You may also group the rows (liken to the pivot table function in Microsoft Excel) to view the grouped data by dragging any column headers into the “row groups” section as highlighted:
Guide
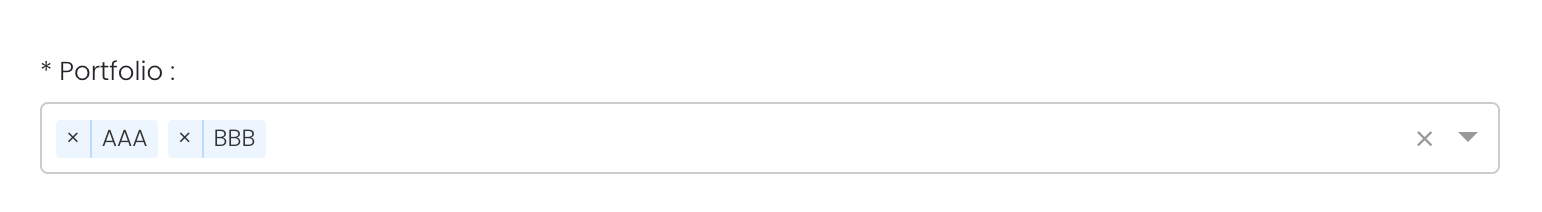
Portfolio |
Select a portfolio of interest. You may select multiple portfolios to be displayed in the model. |
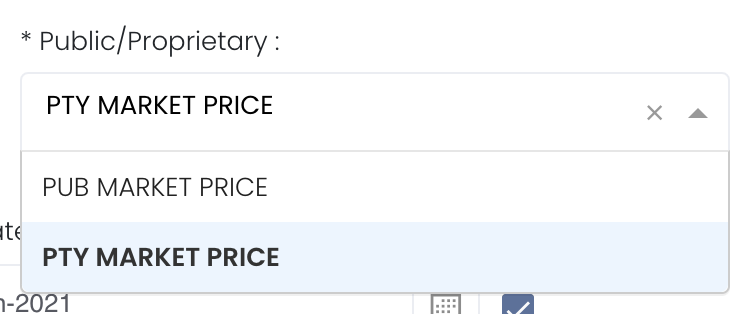
Select public market data or proprietary market data to determine the market data prices used to calculate the P/L or positions accordingly. Please note that if the proprietary (private) market data for certain dates are not input here eg 1 May to 10 May price is input but not 9 May, when you select private data when viewing the portfolio and using the models in Dashboard (eg for trades with trade date on 9 May but private data is not available), the system will use the latest date's settlement price (10 May) to perform the calculations. | |
Duration |
Select the start and end date to determine the range of period and cut-off date for the calculations of P/L. Start Date will be the start of the year (eg 1 Jan 2021) by default. End Date will be yesterday's date by default. End Date cannot be today's date. You are free to edit the dates as necessary. Auto-Update Tick: Resets the dates to default once you leave the ‘Dashboard’ page. Untick: Dates according to your settings remain unchanged once you leave the ‘Dashboard’ page. |
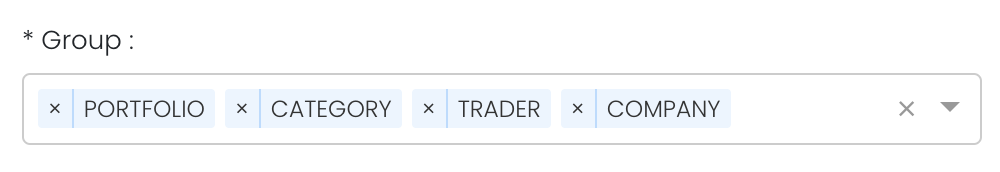
| Group | Select PORTFOLIO, CATEGORY or TRADER or STRATEGY or COMPANY and the columns will appear accordingly in the model. If it is not selected, the columns will not appear. PORTFOLIO is a compulsory field to be included. If you select Company, please ensure that you have set up Paper Brokers table in Company Data to link Broker, Account and Company Name data. Otherwise, an error message will appear, which requires you to either set up the aforementioned, or unselect Company from Group section.
|
| Historical GPPL | If unticked - Compare with Group P/L from open position calculation - Daily change of open position result will always use the latest position data to do calculations If ticked - Compare with historical Group P/L data - Historical Group P/L data will be stored in database on a daily basis and once stored, it will not be updated. (MAF will only update for yesterday data so once user reload the Group P/L app, MAF will insert or update data if the end date is yesterday. |
| Excl T Plus | Tick: Exclude all trades with "T PLUS" (eg T+1) and portfolio P/L and positions will be recalculated Untick: Include all trades with "T PLUS" (eg T+1) and portfolio P/L and positions will be recalculated |
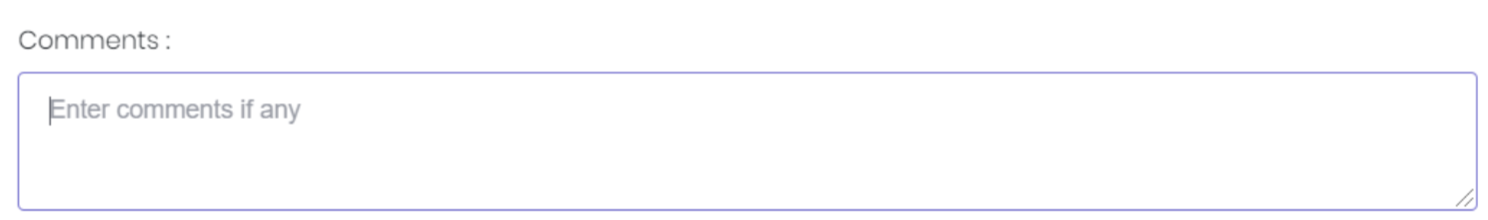
Comments |
The inserted comments will be displayed at the bottom of the application. This can be useful for documentation purposes or for settings description. |
Input
Name | Description | Type | Example |
|---|---|---|---|
| Portfolio | Portfolio selected. | Portfolio (Selection) | ABC |
| Start Date | Start of product time-series. | Date (YYYY-MM-DD) | 2015-06-01 |
| End Date | End of product time-series. | Date (YYYY-MM-DD) | 2019-06-14 |
| Auto Update | Tick: Resets the dates to default once you leave the ‘Dashboard’ page. Untick: Dates according to your settings remain unchanged once you leave the ‘Dashboard’ page. | Checkbox | - |
| Comments | Useful for documentation purposes or for settings description. | Text | - |
Output
Description | Type | |
|---|---|---|
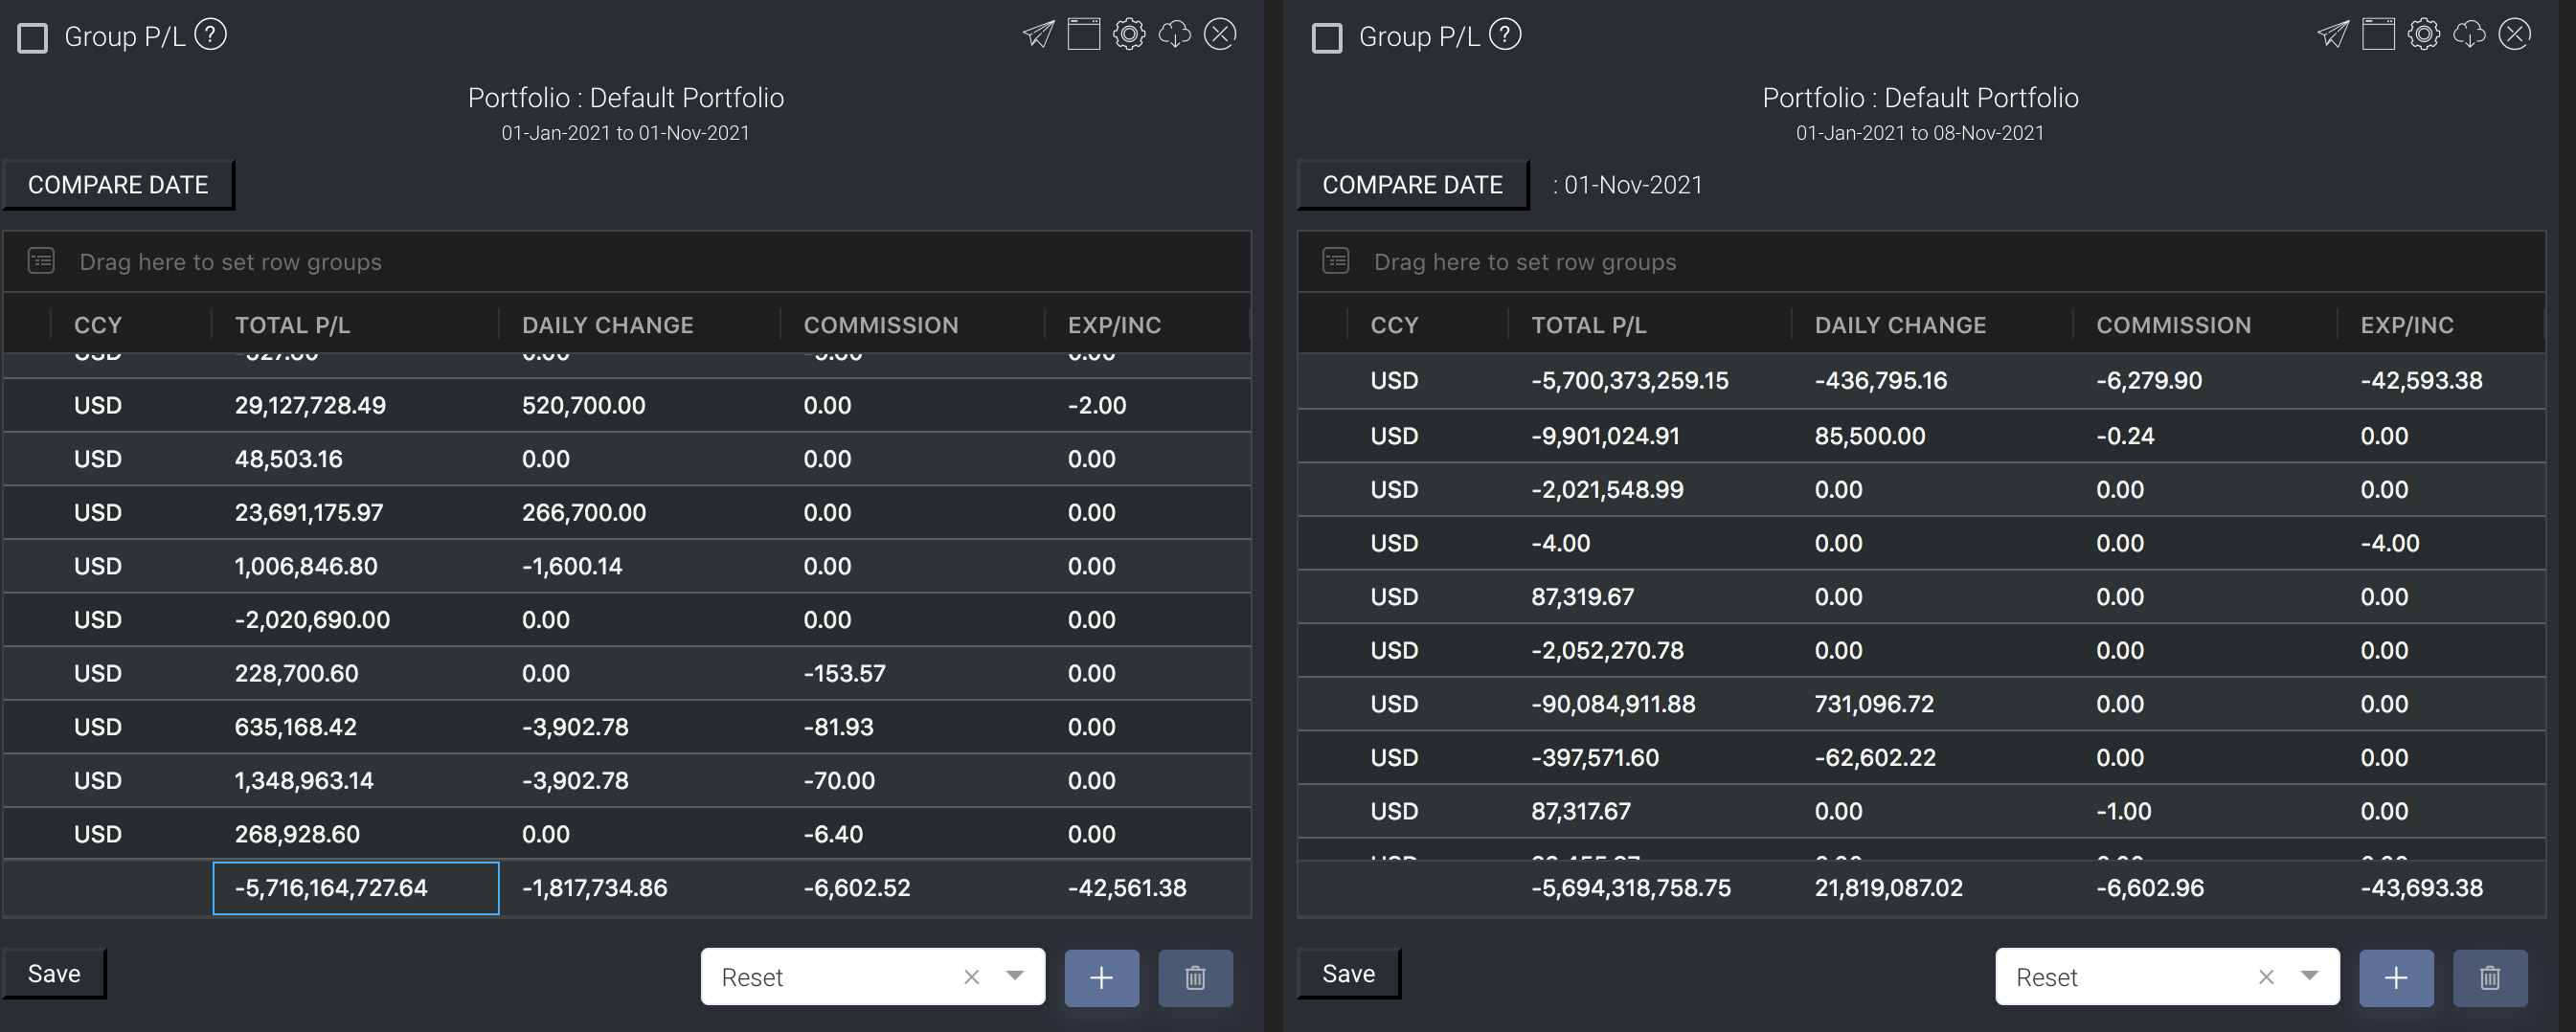
Product/Strategy Information | Provides an overview of all trades and their total P/L, with daily change in P/L, commission and expenses/income details displayed for your convenience. You can categorise according to portfolio name, trader or category to view the sum of all figures at a glance. 'Daily Change' calculations will exclude weekends. You can reorganise your data by dragging-and-dropping the columns at the top of the table to 'set row groups'. COMPARE DATE: Allow user to choose which date to compare with for “Daily Change”. If left empty, the app will automatically use the previous weekday to compare against. | Text |
Example
Daily Change Logic: The Compare Date button on the top left corner of the app will be empty by default, so if you not select specific Compare Date (a.k.a leave Compare Date empty), the system will use the following setting by default and will get the nearest available market data price for comparison
If you want to select specific Compare Date, Daily Change will be calculated by comparing End Date and selected Compare Date, as illustrated below: DAILY CHANGE: Determined by the change in P/L between a date range, for example; change in P/L between today’s date (End Date) and yesterday’s date (Compare Date).
You will be able to save each date’s data into the database for accurate calculations and comparisons. End Date: Select the End Date in Settings page and the respective data ending on the selected End Date will be calculated and displayed. End Date will always use existing calculated data to compare against Compare Date. Compare Date: You can decide the types of data to use for Compare Date to calculate the daily change in P/L between End Date and Compare Date: 1. Existing Calculated Data - After selecting Start Date and End Date in the Settings page, trades you have uploaded will be automatically calculated and displayed in the app. You can save the data into the system database to prevent it from being affected by any changes in calculations, for P/L comparison purposes. This data will be known as Historical Saved Data, please refer to below for more information. 2. Historical Saved Data - Refers to the saving of a selected dataset into the system database which will remain unchanged regardless of any changes to existing calculated data.
The Historical check box in Settings page is used to determine if you want the Compare Date to use Existing Calculated Data or Historical Saved Data for P/L comparison. This means that if you have saved the historical data for the specific End Date, you may:
Test Example:
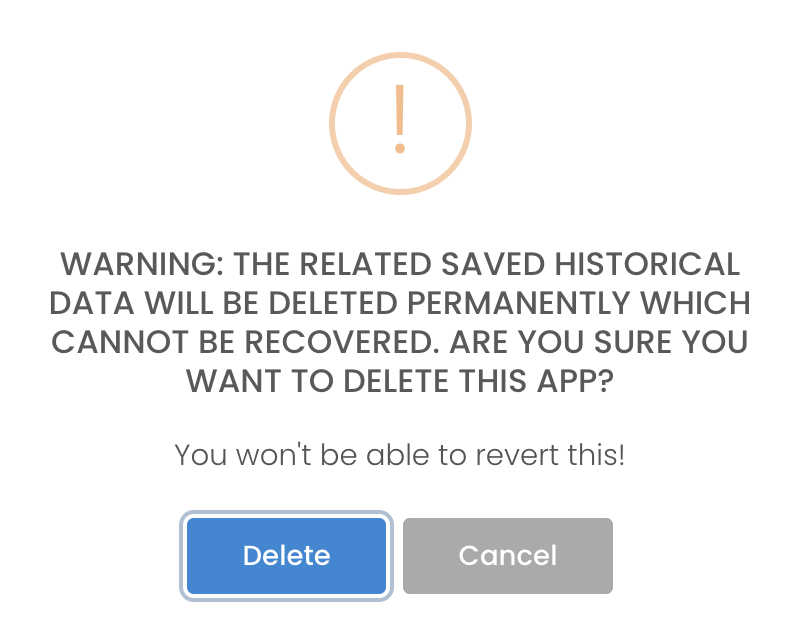
The historical saved data can also be viewed in the Historical Group P/L app, please create the app and once settings are done, the respective saved historical data will appear in the app according to the saved date. Please note that once you close/delete the app, any saved historical data will be deleted permanently to avoid database overload. You may still save the historical data in the same way as illustrated in above steps if the app has been closed/deleted by accident.
|
Tick 'Excl T Plus' (Exclude T Plus) The "EXCL T PLUS" tick box determines if T plus trades (T+1) should be included in the portfolio calculation. So if the tick box is checked, the system will filter out T+1 trades based on the End Date, so the P/L and positions of the portfolio will be calculated accordingly. If the tick box is not checked, the system will include T+1 trades into the portfolio calculations. For example, End Date is yesterday 07 Dec 2021, one of the trades (trade date is 07 Dec 2021) is T+1. If "EXCL T PLUS" tick box is checked, the system will filter out this trade and do recalculation for the P/L and positions in the portfolio. Purpose: In China futures markets, night trading session is considered next day trade (if user trades at 07 Dec 2021 in night session, the trade date is 08 Dec 2021, so the trade is only shown in 08 dec 2021 statement). However, in some exchanges, e.g, CME, there is no such arrangement. It will be considered 07 Dec 2021 trade date and shown in 07 Dec 2021 statement. So if the trade is performed in night session, user can choose to select T+1 under T PLUS column. There will be a case when the user wants to standardise the date when they trade spread trading (e.g., BUY SHANGHAI COPPER and Sell COMEX COPPER in night session). In broker statements, SHANGHAI COPPER is shown in 08 Dec 2021 and COMEX COPPER is shown in 07 Dec 2021. So once you tick "EXCL T PLUS", and End Date is 07 Dec 2021, then COMEX COPPER trade will be filtered out and portfolio P/L and positions will be recalculated. |
Functionality
Please refer to Table Settings for table functionalities.
Definition of Terms
Please refer to List of Definitions: Trades.
Click to access: