FX Exposure Report
IT Support
Return to Overview
About
For companies such as import/export trading company, FX exposure can pose a huge market risk for their business. For example, they import 1,000 MT of copper to China but purchase in USD and sell in RMB (CNY) in China. Any fluctuations in exchange rate of USDCNY can affect their import profit/loss. So they will need to hedge their positions with FX instruments to lock their profit and minimise their loss.
You will be able to use the FX Exposure model to monitor your hedging strategies and how much hedging is required for the FX exposure.
Navigation
To access the quantitative model/report, click on 'Dashboard' from the navigation sidebar on the left.
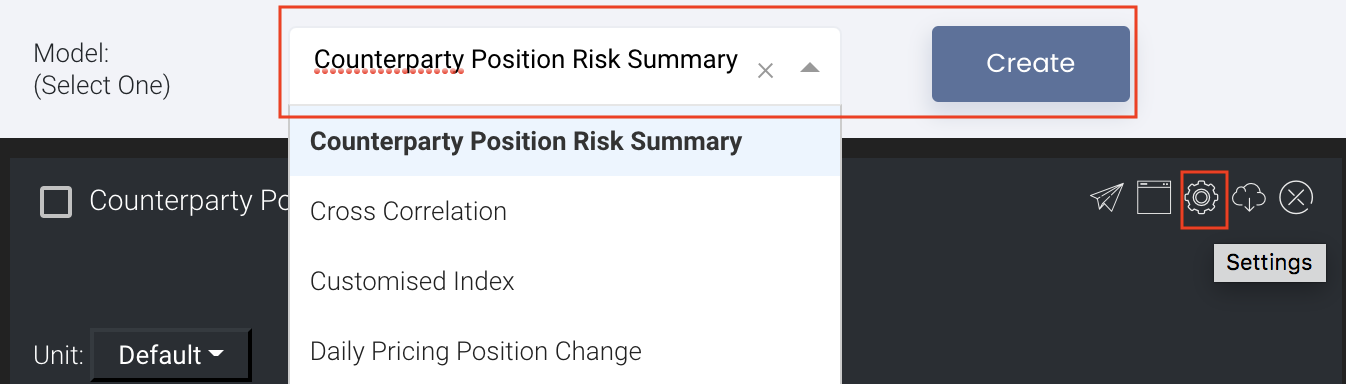
Select the model/report from the drop-down list and click 'Create'. Click on the 'Settings' button (gear icon) at the top right corner of the model to set up your model/report.
Sharing Model/Report/Dashboard
To share the model with your group members, click on the "Share" button next to the Title of the model followed by the email address of the group members you want to share it with. Once submitted, the model will appear in the Dashboard>Group Dashboard of the selected group members.

This is different from sharing individual or entire Dashboard models/reports, which allows any user who may or may not be users of MAF Cloud to access the individual model/entire dashboard via the shared web link (link will expire in 8 hours). In Group Dashboard, only group members can access the shared models/reports.
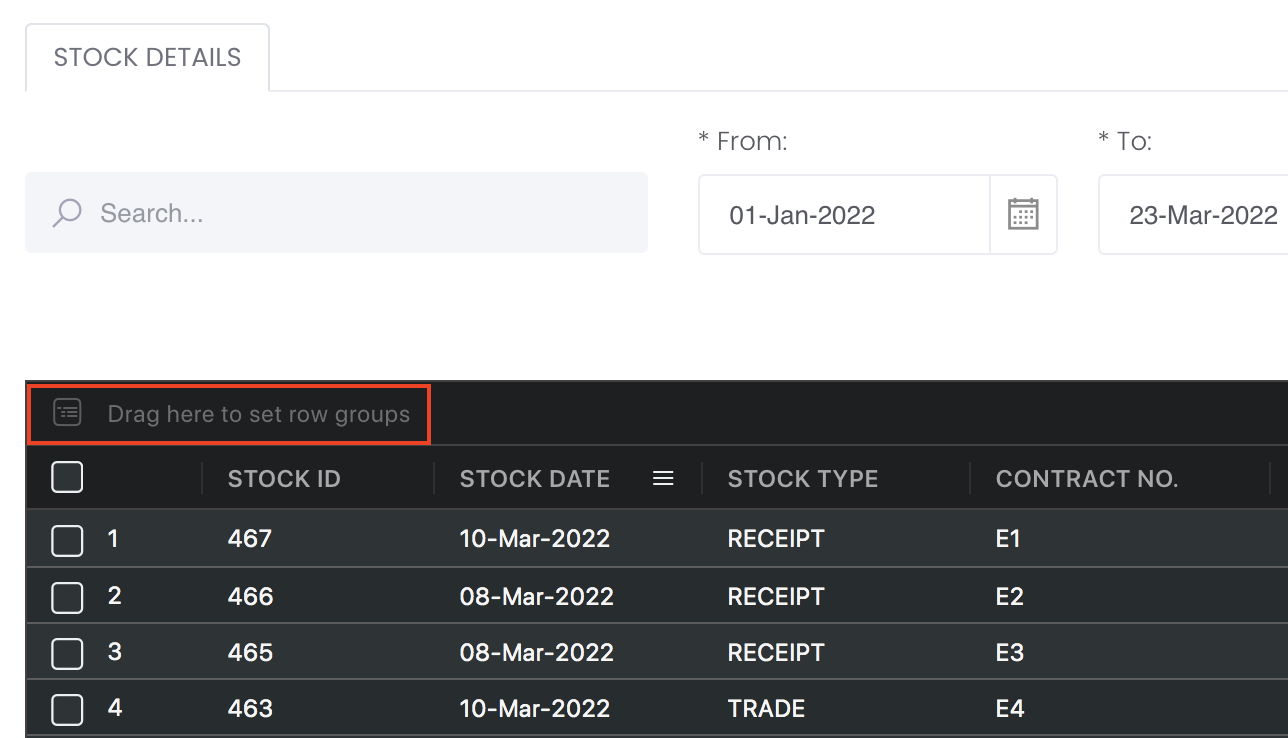
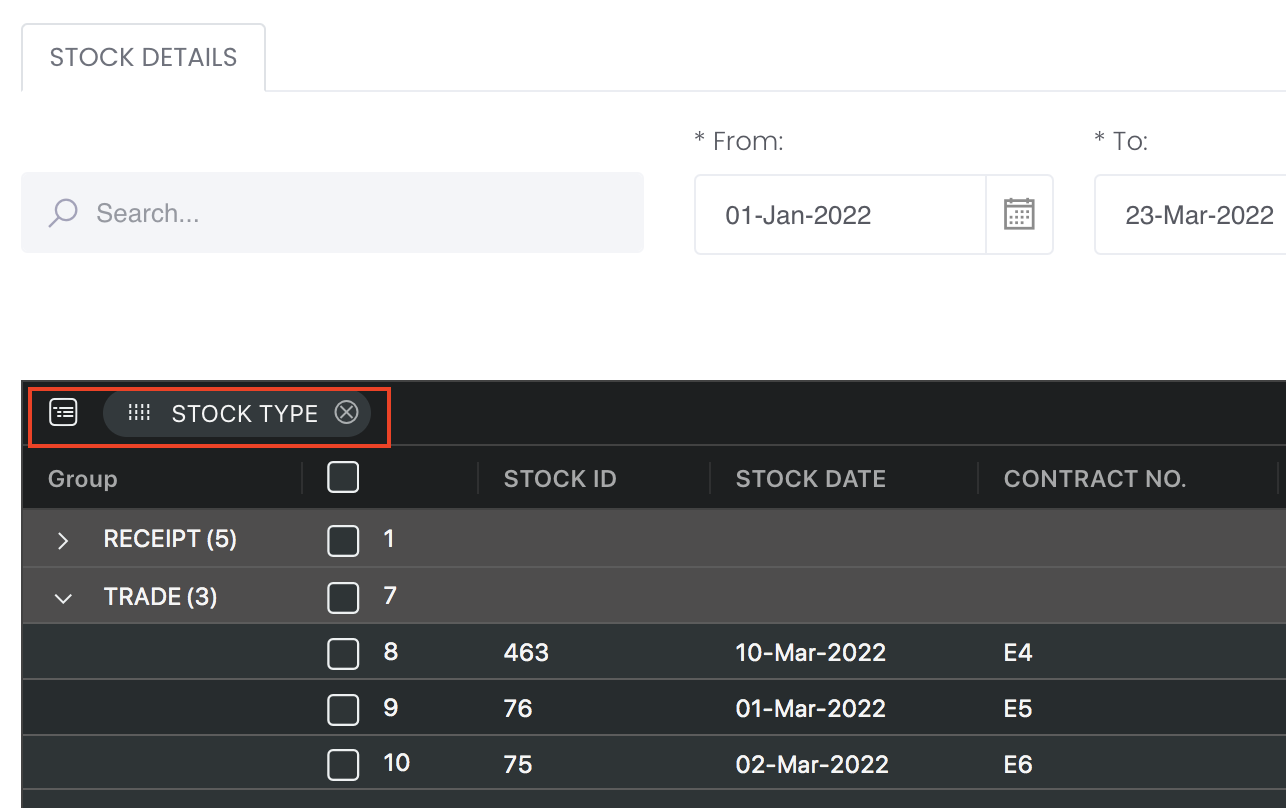
Group Rows
You may also group the rows (liken to the pivot table function in Microsoft Excel) to view the grouped data by dragging any column headers into the “row groups” section as highlighted:
Tick 'Excl T Plus' (Exclude T Plus)
The "EXCL T PLUS" tick box determines if T plus trades (T+1) should be included in the portfolio calculation.
So if the tick box is checked, the system will filter out T+1 trades based on the End Date, so the P/L and positions of the portfolio will be calculated accordingly.
If the tick box is not checked, the system will include T+1 trades into the portfolio calculations.
For example, End Date is yesterday 07 Dec 2021, one of the trades (trade date is 07 Dec 2021) is T+1. If "EXCL T PLUS" tick box is checked, the system will filter out this trade and do recalculation for the P/L and positions in the portfolio.
Purpose:
In China futures markets, night trading session is considered next day trade (if user trades at 07 Dec 2021 in night session, the trade date is 08 Dec 2021, so the trade is only shown in 08 dec 2021 statement). However, in some exchanges, e.g, CME, there is no such arrangement. It will be considered 07 Dec 2021 trade date and shown in 07 Dec 2021 statement.
There will be a case when the user wants to standardise the date when they trade spread trading (e.g., BUY SHANGHAI COPPER and Sell COMEX COPPER in night session). In broker statements, SHANGHAI COPPER is shown in 08 Dec 2021 and COMEX COPPER is shown in 07 Dec 2021. So once you tick "EXCL T PLUS", and End Date is 07 Dec 2021, then COMEX COPPER trade will be filtered out and portfolio P/L and positions will be recalculated.
Guide
| Name | Image/Description |
|---|---|
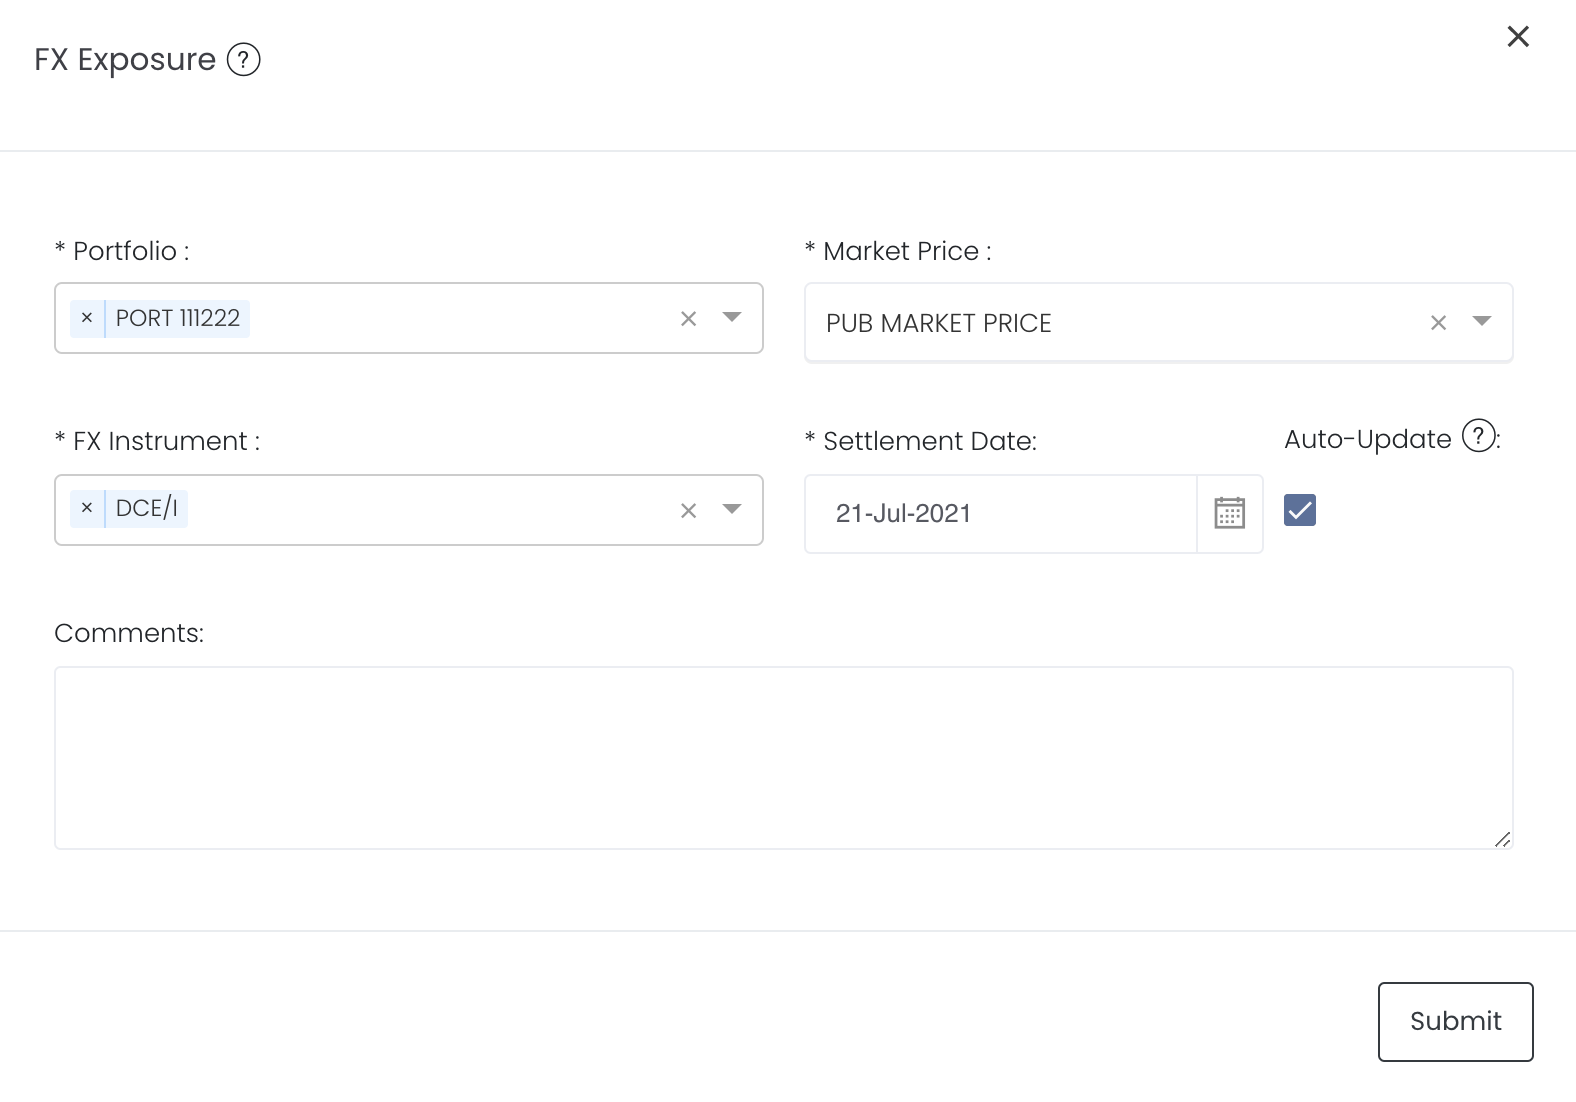
| Portfolio |
Select a/multiple portfolio(s) of interest. |
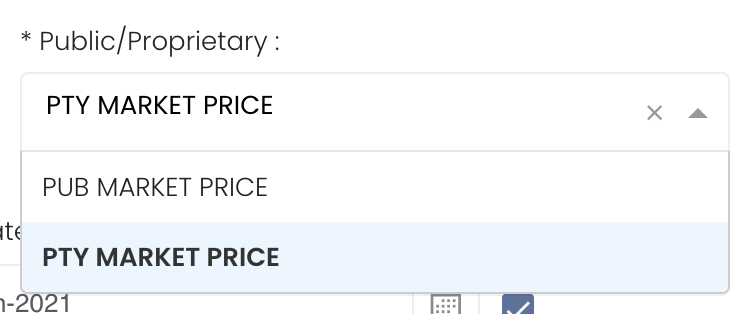
| Market Price |
Selectpublic market dataorproprietary market data to determine the market data prices used to calculate the P/L or positions accordingly. Please note that if the proprietary (private) market data for certain dates are not input here eg 1 May to 10 May price is input but not 9 May, when you select private data when viewing the portfolio and using the models in Dashboard (eg for trades with trade date on 9 May but private data is not available), the system will use the latest date's settlement price (10 May) to perform the calculations. |
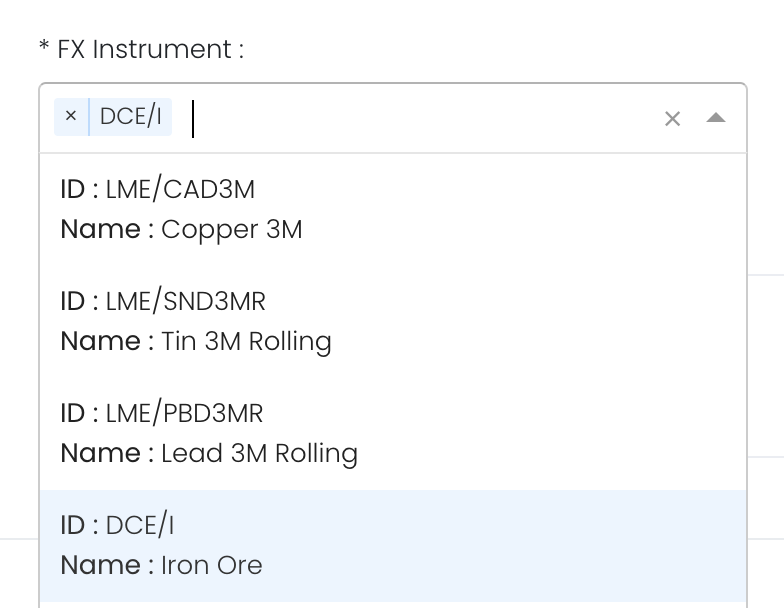
| FX Instrument | Select the FX Instrument(s) to hedge your positions.
|
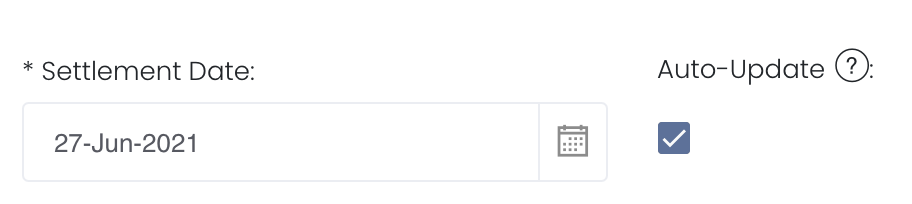
| Settlement Date |
Select the Settlement Date of the daily statement date. Auto-Update Tick: Resets the dates to default once you leave the ‘Dashboard’ page. Untick: Dates according to your settings remain unchanged once you leave the ‘Dashboard’ page. |
| Excl T Plus | Tick: Exclude all trades with "T PLUS" (eg T+1) and portfolio P/L and positions will be recalculated Untick: Include all trades with "T PLUS" (eg T+1) and portfolio P/L and positions will be recalculated |
| Comments |
The inserted comments will be displayed at the bottom of the application. This can be useful for documentation purposes or for settings description. |

Input
| Description | Type | Example | |
|---|---|---|---|
| Portfolio | Portfolio selected. | Selection | AAA |
| Market Price | Choose to use public market price or proprietary market price | Selection | PUB Market Price |
| FX Instrument | Select the FX instrument to hedge your positions | Selection | DCE/I |
| Settlement Date | Fill in the settlement date/select the date from the calendar icon. | Date | 27-Jun-2021 |
| Comments | Useful for documentation purposes or for settings description. | Text | - |
Output
| Name | Description | Type |
|---|---|---|
| FX Exposure | FX Instrument: Select the FX instrument to hedge your positions. You should not choose the FX instrument that is identical to the product of your trade, as it will nett off each other. You should thus choose a different FX instrument to hedge your positions (different product of your trade). Note: If PRICED_IN is TRUE for a trade, it will not appear in FX Exposure model, since price is already included so there is deemed to be no market risk. Trades will be categorised into master row and children row. Master row is the summation of child row. GROSS EXPOSURE: NET POSITION * AVG PRICE FX HEDGE: ADJUSTMENT (ADJ): Input the Adjustment which will be added from GROSS EXPOSURE to obtain the NET EXPOSURE. NET EXPOSURE: GROSS EXPOSURE + FX HEDGE + ADJ | Table |
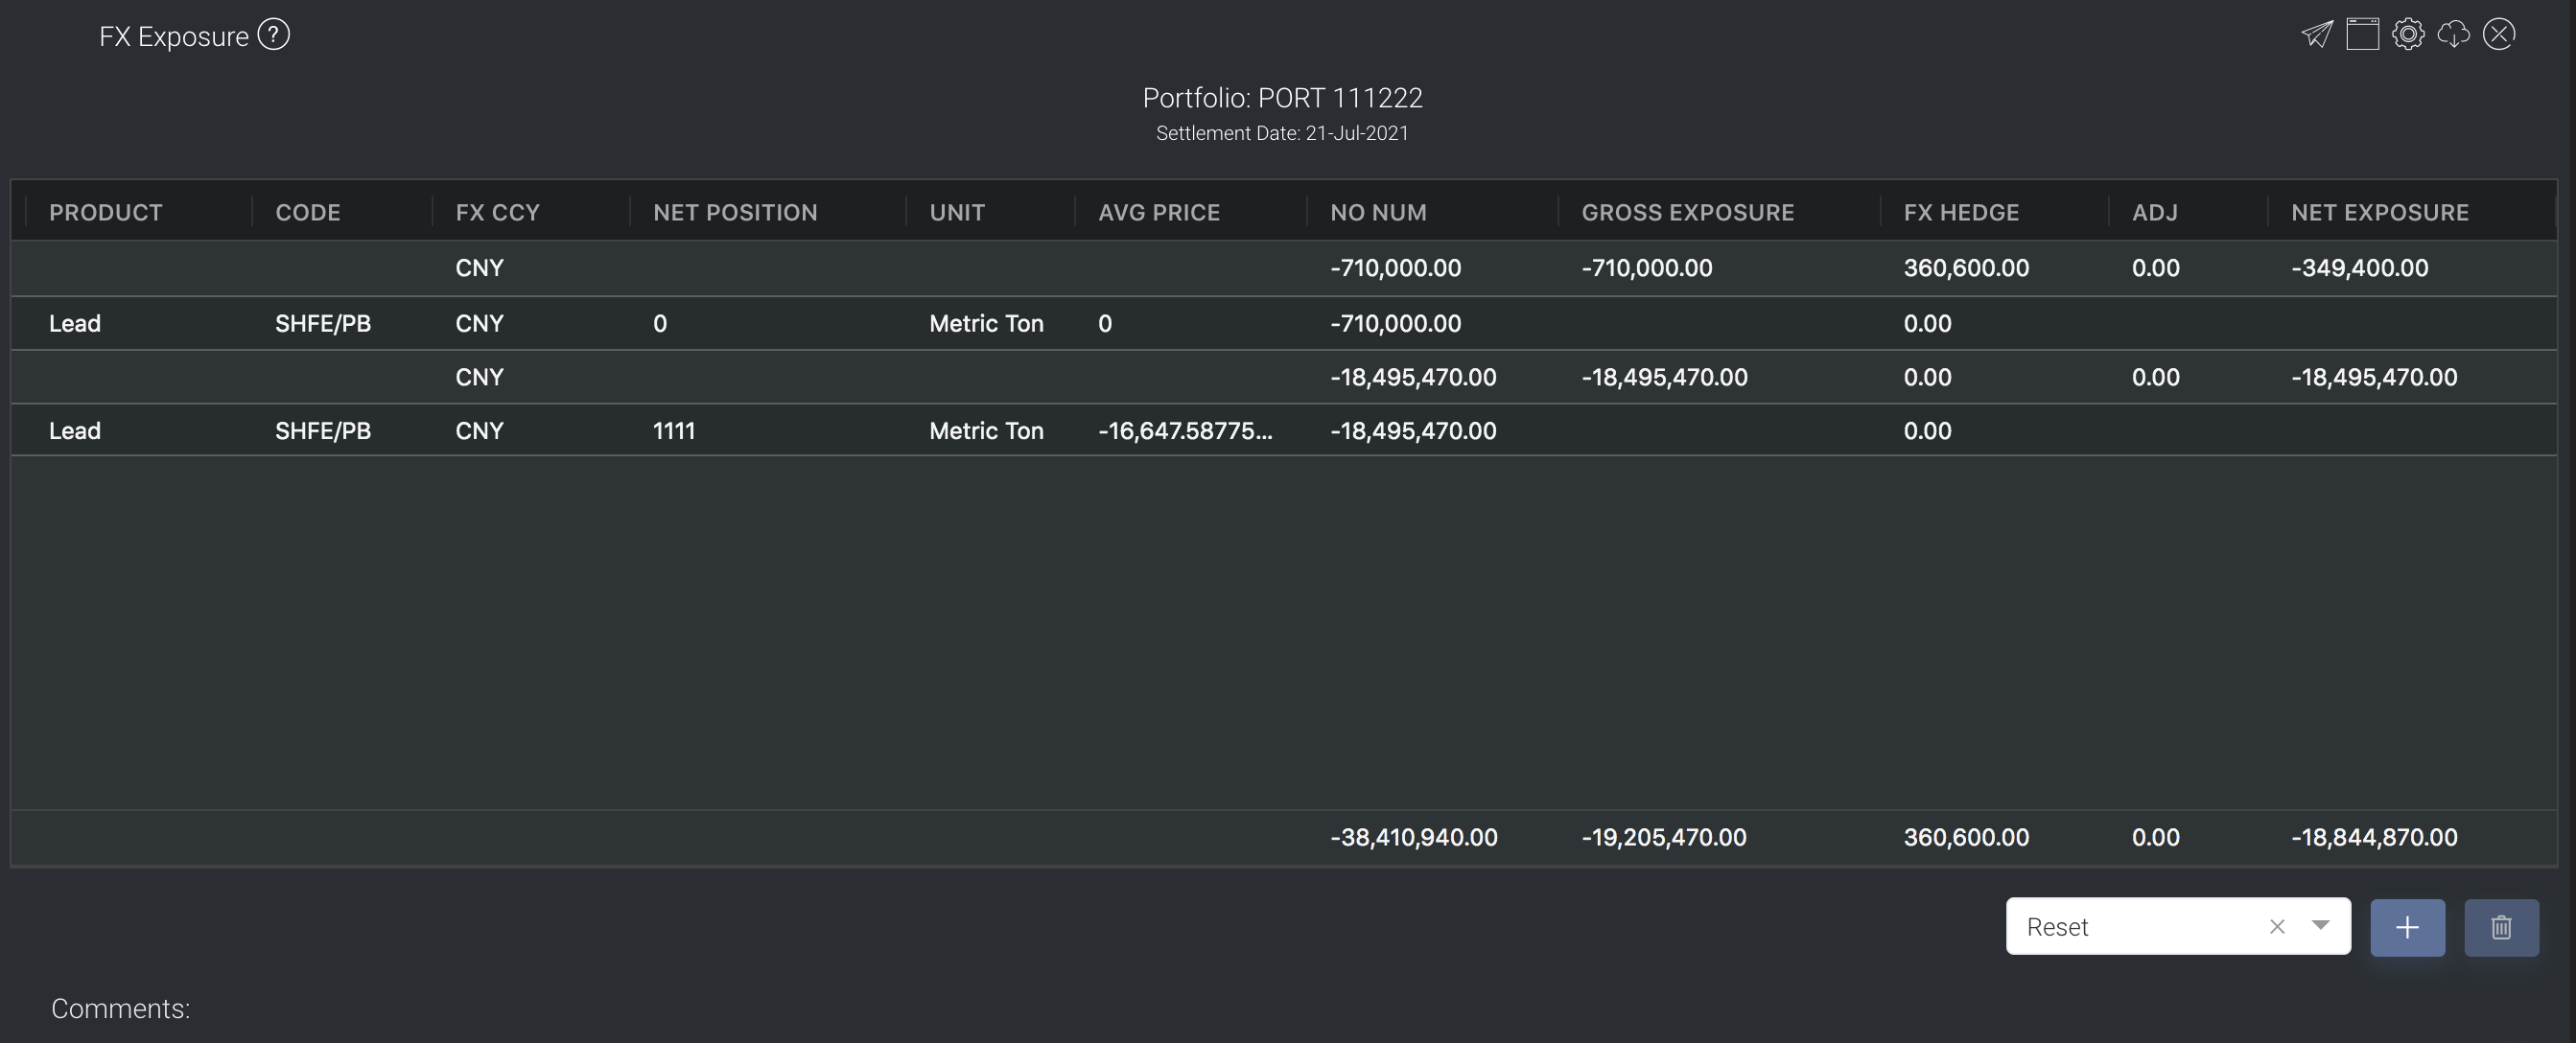
Example:
- 1000 metric ton, price is 20, gross exposure is 20,000
- -1000 metric ton, price is 50, gross exposure is -50,000
so sum up position is 0 (1000 - 1000), since net position is 0, so avg price is 0, but gross exposure is -30,000