Value at Risk (VaR) Model
- IT Support
- e0031959 (Unlicensed)
- Christabel Chiang (Unlicensed)
Return to Overview
About
Value-at-Risk (VaR) is a common measure of the degree of risk a portfolio is exposed to, by calculating how much an investor might lose with his/her portfolio, given a certain probability, within a certain time period. For example, a 1-day VaR of $1000 with 95% confidence interval implies that the portfolio might lose $1000 or more with 5% probability in 1 day.
The Value-at-Risk model simulates a large number of outcomes of the portfolio's performance, based on the assets' past returns and volatility data, and displays the portfolio's projected profit or loss (P/L) as a probability distribution. The amount of P/L is shown on the horizontal axis (X-axis), while the likelihood measures are shown on the vertical axis (Y-axis). 2 plots are created: the probability density bar chart shows the frequencies of the various P/L outcomes, while the cumulative distribution graph shows the probability of losing that amount or more.
Losses beyond a certain threshold (ie. probability of loss < 1 - confidence interval) are highlighted on the left tail of the graph. Furthermore, 2 values are calculated and displayed: VaR is the threshold value, while shortfall value is the probability-weighted average of the tail losses.
Below Shortfall, Add Sample to show Size 样本数
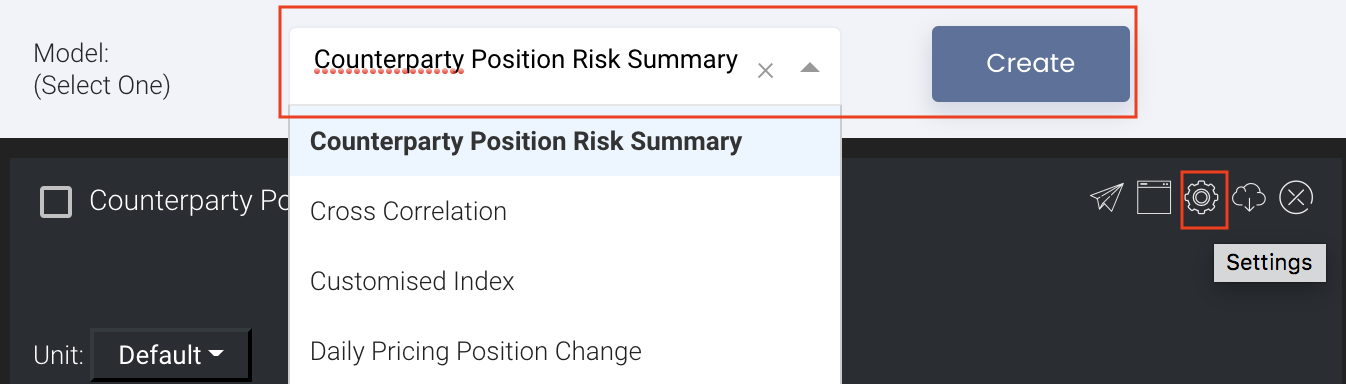
To access the quantitative model/report, click on 'Dashboard' from the navigation sidebar on the left.

Select the model/report from the drop-down list and click 'Create'. Click on the 'Settings' button (gear icon) at the top right corner of the model to set up your model/report.
To share the model with your group members, click on the "Share" button next to the Title of the model followed by the email address of the group members you want to share it with. Once submitted, the model will appear in the Dashboard>Group Dashboard of the selected group members.

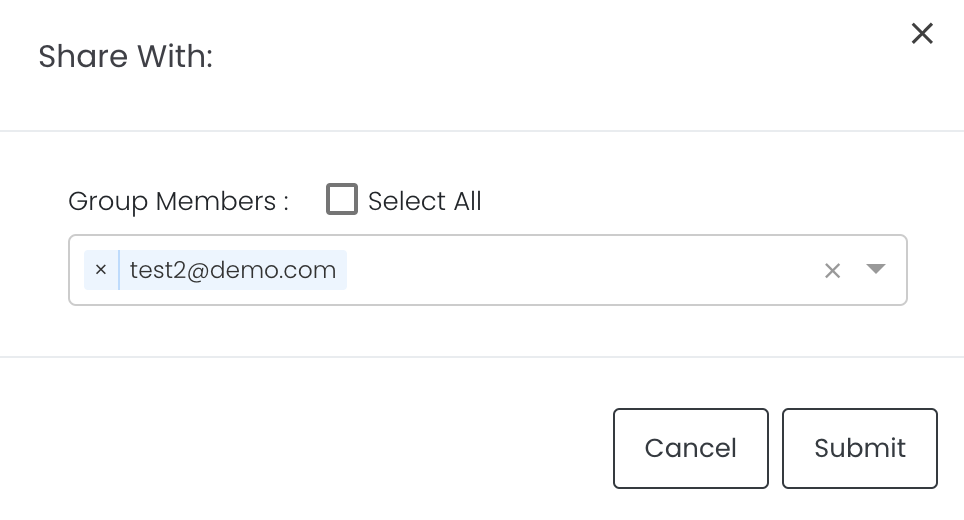
This is different from sharing individual or entire Dashboard models/reports, which allows any user who may or may not be users of MAF Cloud to access the individual model/entire dashboard via the shared web link (link will expire in 8 hours). In Group Dashboard, only group members can access the shared models/reports.
Guide
| Name | Image/Description |
|---|---|
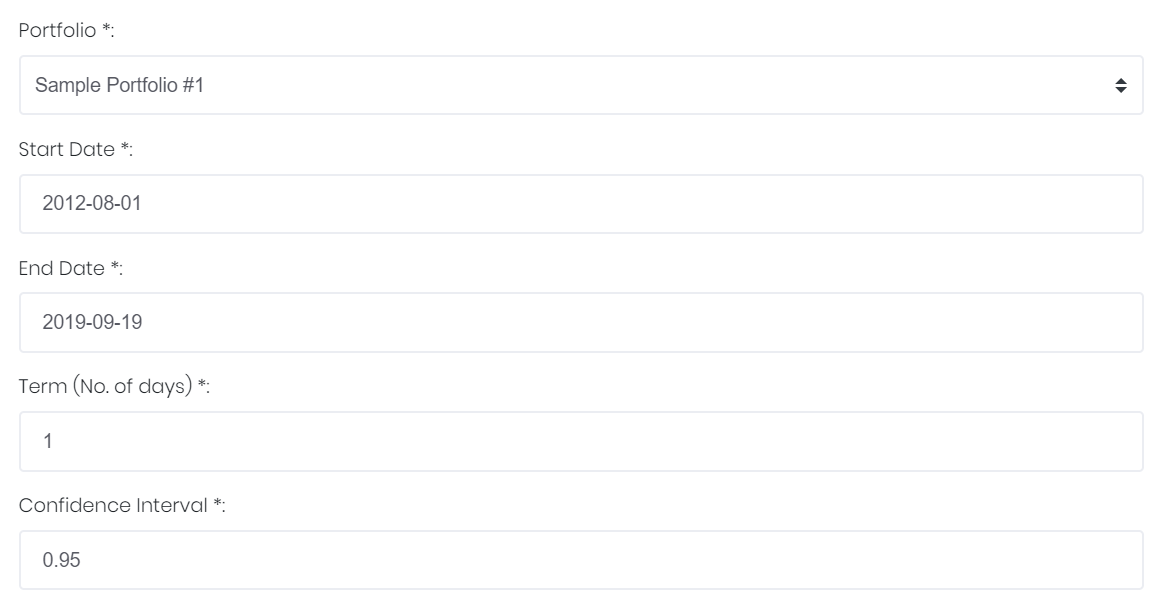
| Portfolio |
Select a portfolio of interest. |
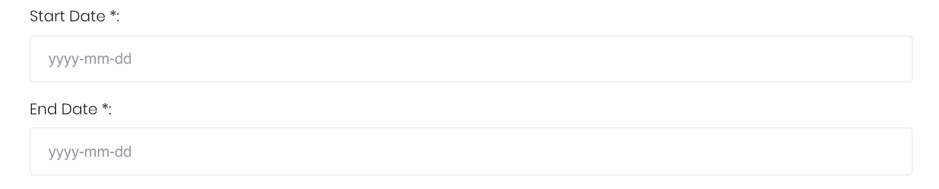
| Duration |
Select the start and end date for which data of the assets in the portfolio will be retrieved for analysis. |
| Days |  Number of days for VaR analysis. |
| Confidence Interval |
Select the confidence interval for analysis, a decimal value between 0 and 1. |
| Minimum value for display of P/L range (x-axis) | |
| Maximum value for display of P/L range (x-axis) | |
| Comments |
The inserted comments will be displayed at the bottom of the application. This can be useful for documentation purposes or for settings description. |


Input
| Name | Description | Type | Example |
|---|---|---|---|
| Portfolio | Portfolio to be analysed. | Portfolio (Selection) | Sample portfolio #1 |
| Start Date | Start date for VaR analysis. | Date (YYYY-MM-DD) | 2012-08-01 |
| End Date | End date for VaR analysis. | Date (YYYY-MM-DD) | 2019-09-19 |
| Days | Number of days for VaR analysis. | Numerical Value | 1 |
| Confidence Interval | Confidence interval for analysis. | Numerical Value | 0.95 |
| Comments | Useful for documentation purposes or for settings description. | Text | - |
Output
| Name | Description | Type |
|---|---|---|
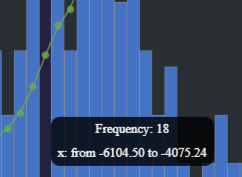
| Probability Density Bar Chart | The probability density bar charts (in blue and purple) show the frequencies of the various P/L outcomes; their unit range is shown on the left Y-axis. | Plot |
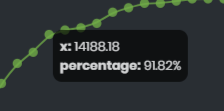
| Cumulative Distribution Graph | The cumulative distribution graph (in green) shows the probability of the portfolio losing that amount or more; its unit range is shown on the right Y-axis. | Plot |
| Significant Values | Value-at-Risk: Losses beyond this value have a probability less than the threshold probability, ie. P(profit<VaR) < 1 - confidence interval. Shortfall Value: The probability-weighted average of the tail losses (highlighted in purple): shortfall value = Σ(profit*frequency)/Σ(frequency), where profit<VaR | Numerical Value |
Example
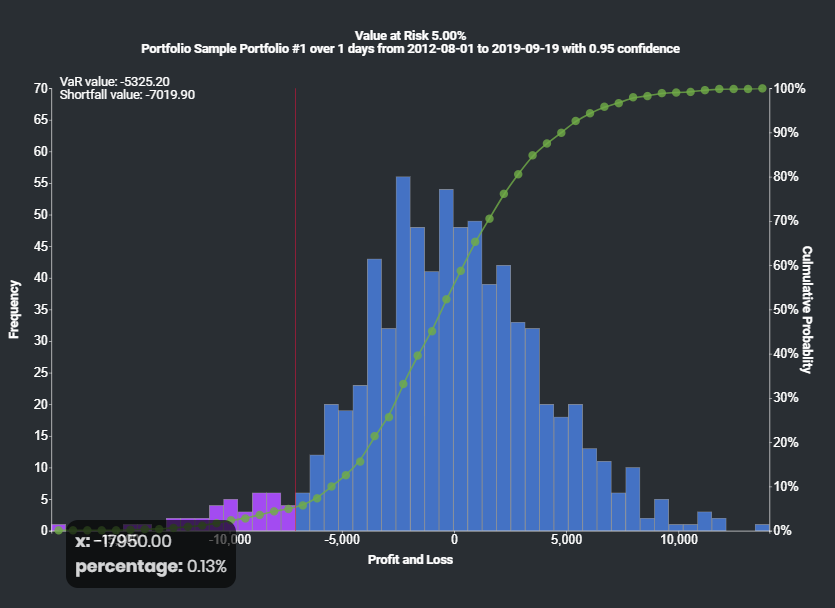
This portfolio has a 5% probability of losing $5325.20 or more in 1 day, and a very slight probability (p=0.13%) of losing up to $17950.
Functionality
Displayed below are some noteworthy user interactions you can find on this application.
Name | Description | Interaction |
|---|---|---|
| Cumulative Distribution Graph Tooltip | Mousing-over points on the cumulative probability graph would display the following: X-value: P/L amount Percentage: Cumulative probability of losing that amount or more, ie. P (profit < x)
| Plot Element |
| Bar Chart Tooltip | Mousing-over the selected bar in the bar chart would display the x-range (ie. P/L range) and its frequency.
| Plot Element |
Click to access: