Portfolio Statistics Table
- MAF Intern (Unlicensed)
- IT Support
- Christabel Chiang (Unlicensed)
Return to Overview
About
The Portfolio Statistics Table provides a table of key statistics of a trader's portfolio – such as standard deviation and various ratios. The user can also include a benchmark (a commodity or index) against which these statistics are compared (the benchmark is chosen by the user – 1 column shows statistics for the portfolio, and another for the benchmark). Please refer to 'Output' below for a more comprehensive description of each statistic (please also refer to Portfolio Performance Table for other statistics of portfolio performance).
Guide
Name | Image/Description |
|---|---|
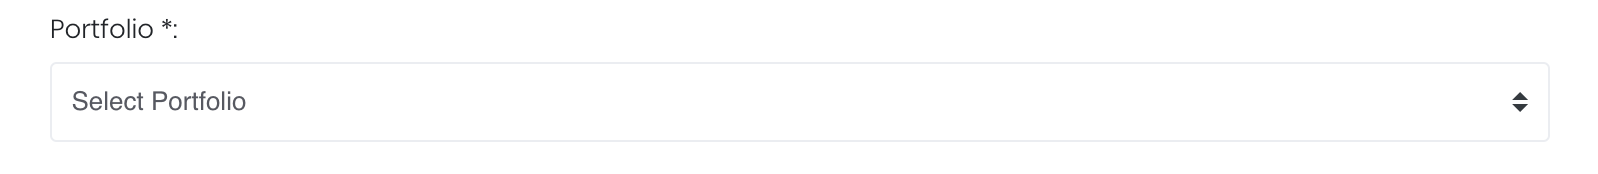
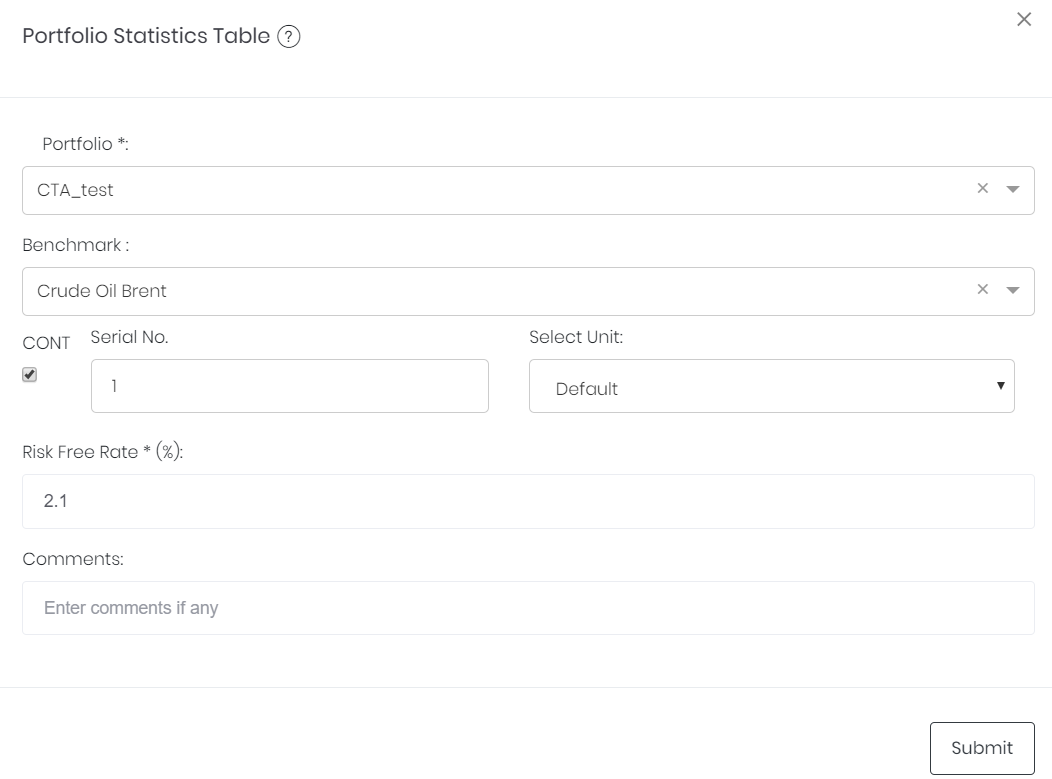
| Portfolio |
Select a portfolio of interest. |
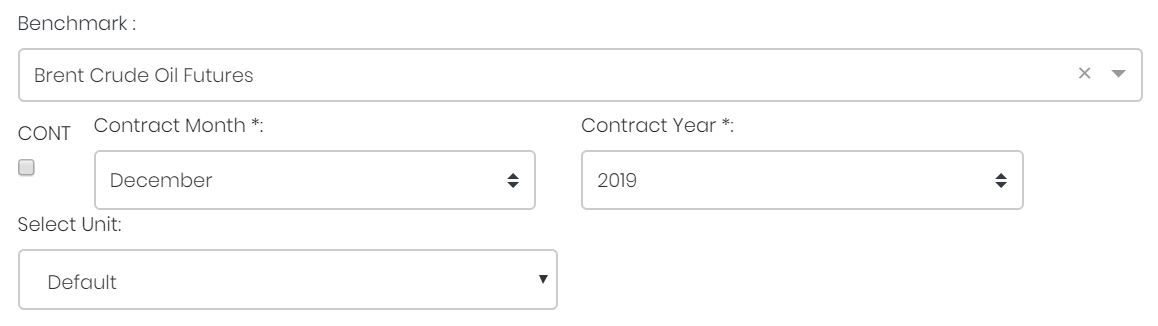
| Benchmark |
Select a benchmark (of which its summary statistics are shown, and against which the portfolio is compared). If it is a future continuous contract, tick checkbox 'CONT' and fill in the 'Serial No.'. For more information, please refer to Futures Continuous Contract Data Setting. Otherwise, select the 'Contract Month' and 'Contract Year' for the product(s) of interest. |
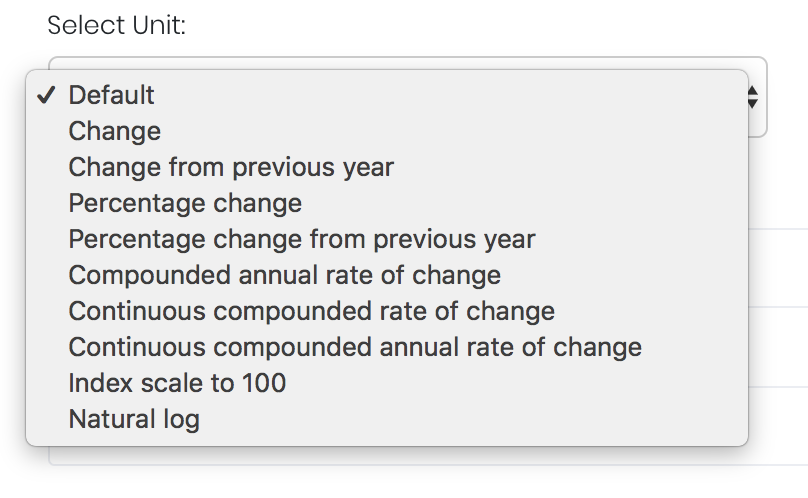
| Select Unit |
Select the unit for the product. You may leave it as "Default". For more information about other units, please refer to Select Unit (Data Transformation Tool). |
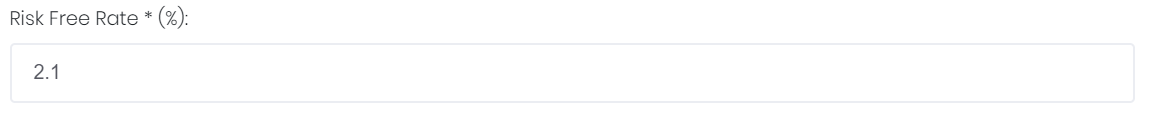
| Risk Free Rate (%) |
The risk-free interest rate is inserted by the user and is used in calculating various portfolio statistics. (The current T-bill rate is the suggested risk-free rate.) |
| Comments |
The inserted comments will be displayed at the bottom of the application. This can be useful for documentation purposes or for settings description. |

Input
Name | Description | Type | Example |
|---|---|---|---|
| Portfolio | Portfolio to be analysed. | Portfolio (selection) | ABC |
| Benchmark | Product to be used as a benchmark. | Product Name | Brent Crude Oil Futures |
| Contract month. | Month | July | |
| Contract year. | Year | 2019 | |
| Continuous contract (for more information, please refer to Futures Continuous Contract Data Setting). | Checkbox | - | |
| Serial number of starting futures contract (for more information, please refer to Futures Continuous Contract Data Setting). | Numerical Value | 1 | |
| Unit (for more information, please refer to Select Unit (Data Transformation Tool)). | Unit | Default | |
| Risk Free Rate (%) | The risk-free interest rate (inserted by user) to be used in calculating portfolio statistics. | Numerical Value | 2.1 |
| Comments | Useful for documentation purposes or for settings description. | Text | - |
Output
Name | Description | Formula |
|---|---|---|
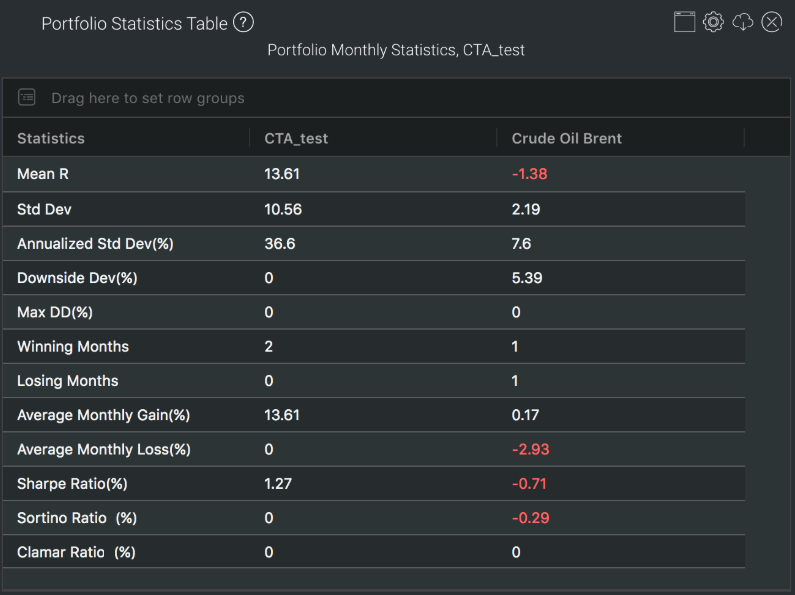
| Mean R | Average of monthly returns. | (R1+R2+ R3+...RN) / N |
| Std Dev (%) | Root-mean-square of deviations from the mean (for monthly data). | sqrt(((R1 – M)2 + (R2 – M)2 + … + (RN – M)2) / (N-1)) |
| Annualised Std Dev (%) | Annualised standard deviation. | Std Dev* sqrt(12) |
| Downside Dev (%) | Root-mean-square of excess returns only for underperforming months (where return < risk-free rate). | sqrt((D12 + D22 + … + DN2) / N) , where Di = min(Ri – Rfr, 0) |
| Max DD (%) | Max Drawdown: largest historical percentage decline in value (from peak to trough). | max((VAMIj – VAMIi ) / VAMIi) *100%, where j > i |
| Winning Months | Number of months with positive returns. | count(i), where Ri ≥ 0 |
| Losing Months | Number of months with negative returns. | count(i), where Ri < 0 |
| Average Monthly Gain (%) | Average gain in winning months. | (W1 + W2 + W3 + … WN) / Winning Months, where Wi = max(0,Ri) |
| Average Monthly Loss (%) | Average loss in losing months. | (L1 + L2 + L3 + … LN) / Losing Months, where Li = min(0,Ri) |
| Sharpe Ratio | Ratio of excess return (above the risk-free rate) to standard deviation; a risk-adjusted measure of return. | (M - Rfr) / Std Dev |
| Sortino Ratio | Ratio of excess compounded monthly return to downside deviation; a modified risk-adjusted return accounting only for downside risk. | (Compounded Monthly Return - Rfr) / Downside Dev |
| Clamar Ratio | Ratio of compounded annual return to maximum drawdown; yet another measure of risk-adjusted return. | Compounded Annual Return / Max DD |
Formula Symbols:
R = Return
N = Number of months
M = Mean return
Rfr = Risk-free rate
VAMI = Value-Added Monthly Index = Amount in the portfolio for a given month assuming an initial investment of $1000
Example
Functionality
Please refer to Table Settings for table functionalities.
Click to access: