Seasonal Analysis Model
- Herougan No (Unlicensed)
- IT Support
- e0031959 (Unlicensed)
Return to Overview
About
Some products may display seasonality – that is, predictable patterns which repeat themselves every year (for example, retail sales tend to be higher nearer to the end of the year). In this model, an average of the product's value at each time of the year (averaged over multiple years) is shown, alongside the trend in a particular (usually the current) year. Furthermore, the maximum and minimum value for each time of the year are shown, to reveal any seasonal dependence in the product's volatility and/or estimate the significance of seasonal patterns.
This model can be used to:
- Detect and examine seasonal patterns in a product's performance,
- Predict movements in the near future using historical seasonal data,
- Compare the product's current performance against historical benchmarks at the same time in previous years.
Guide
| Image/Description | |
|---|---|
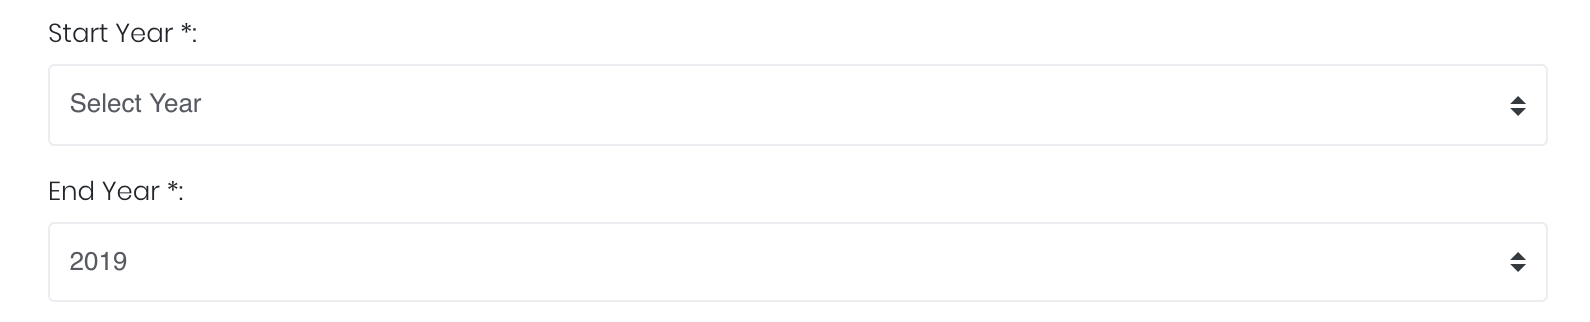
| Duration |
Select the start and end year for which the product's seasonality is analysed. |
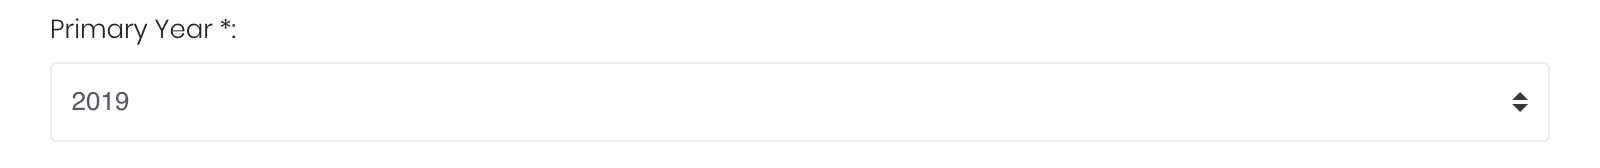
| Primary Year |
The product's performance in the primary year will be displayed alongside its seasonality data. |
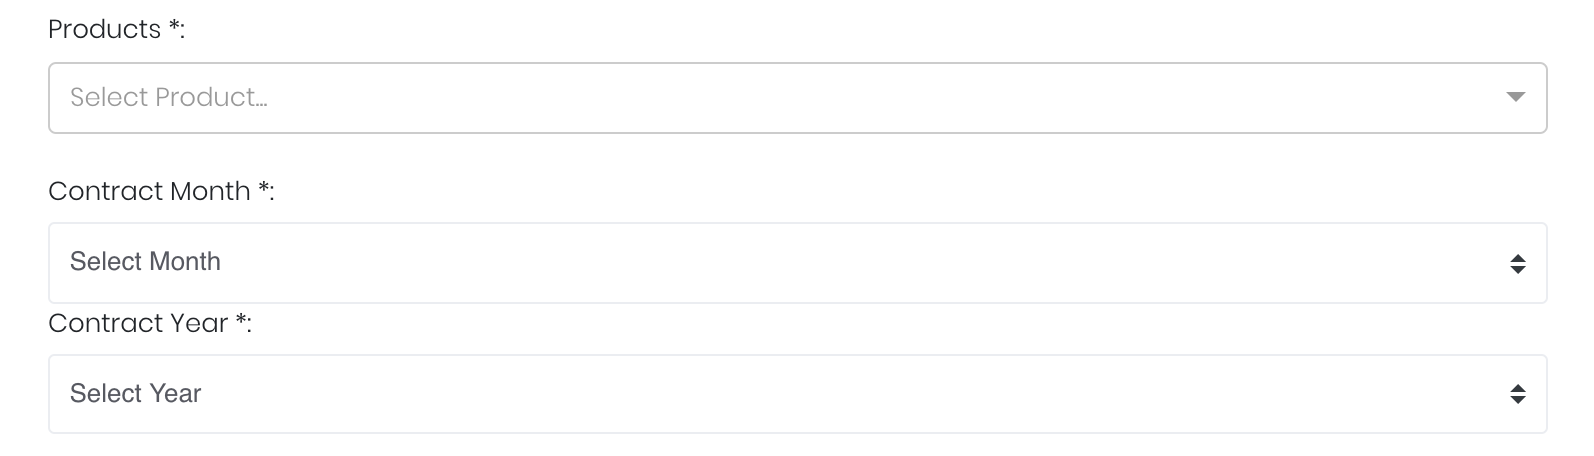
| Product |
Input product of interest under 'Product'. Input 'Contract Month' and 'Contract Year' for product of interest. |
| Comments |
The inserted comments will be displayed at the bottom of the application. This can be useful for documentation purposes or for settings description. |

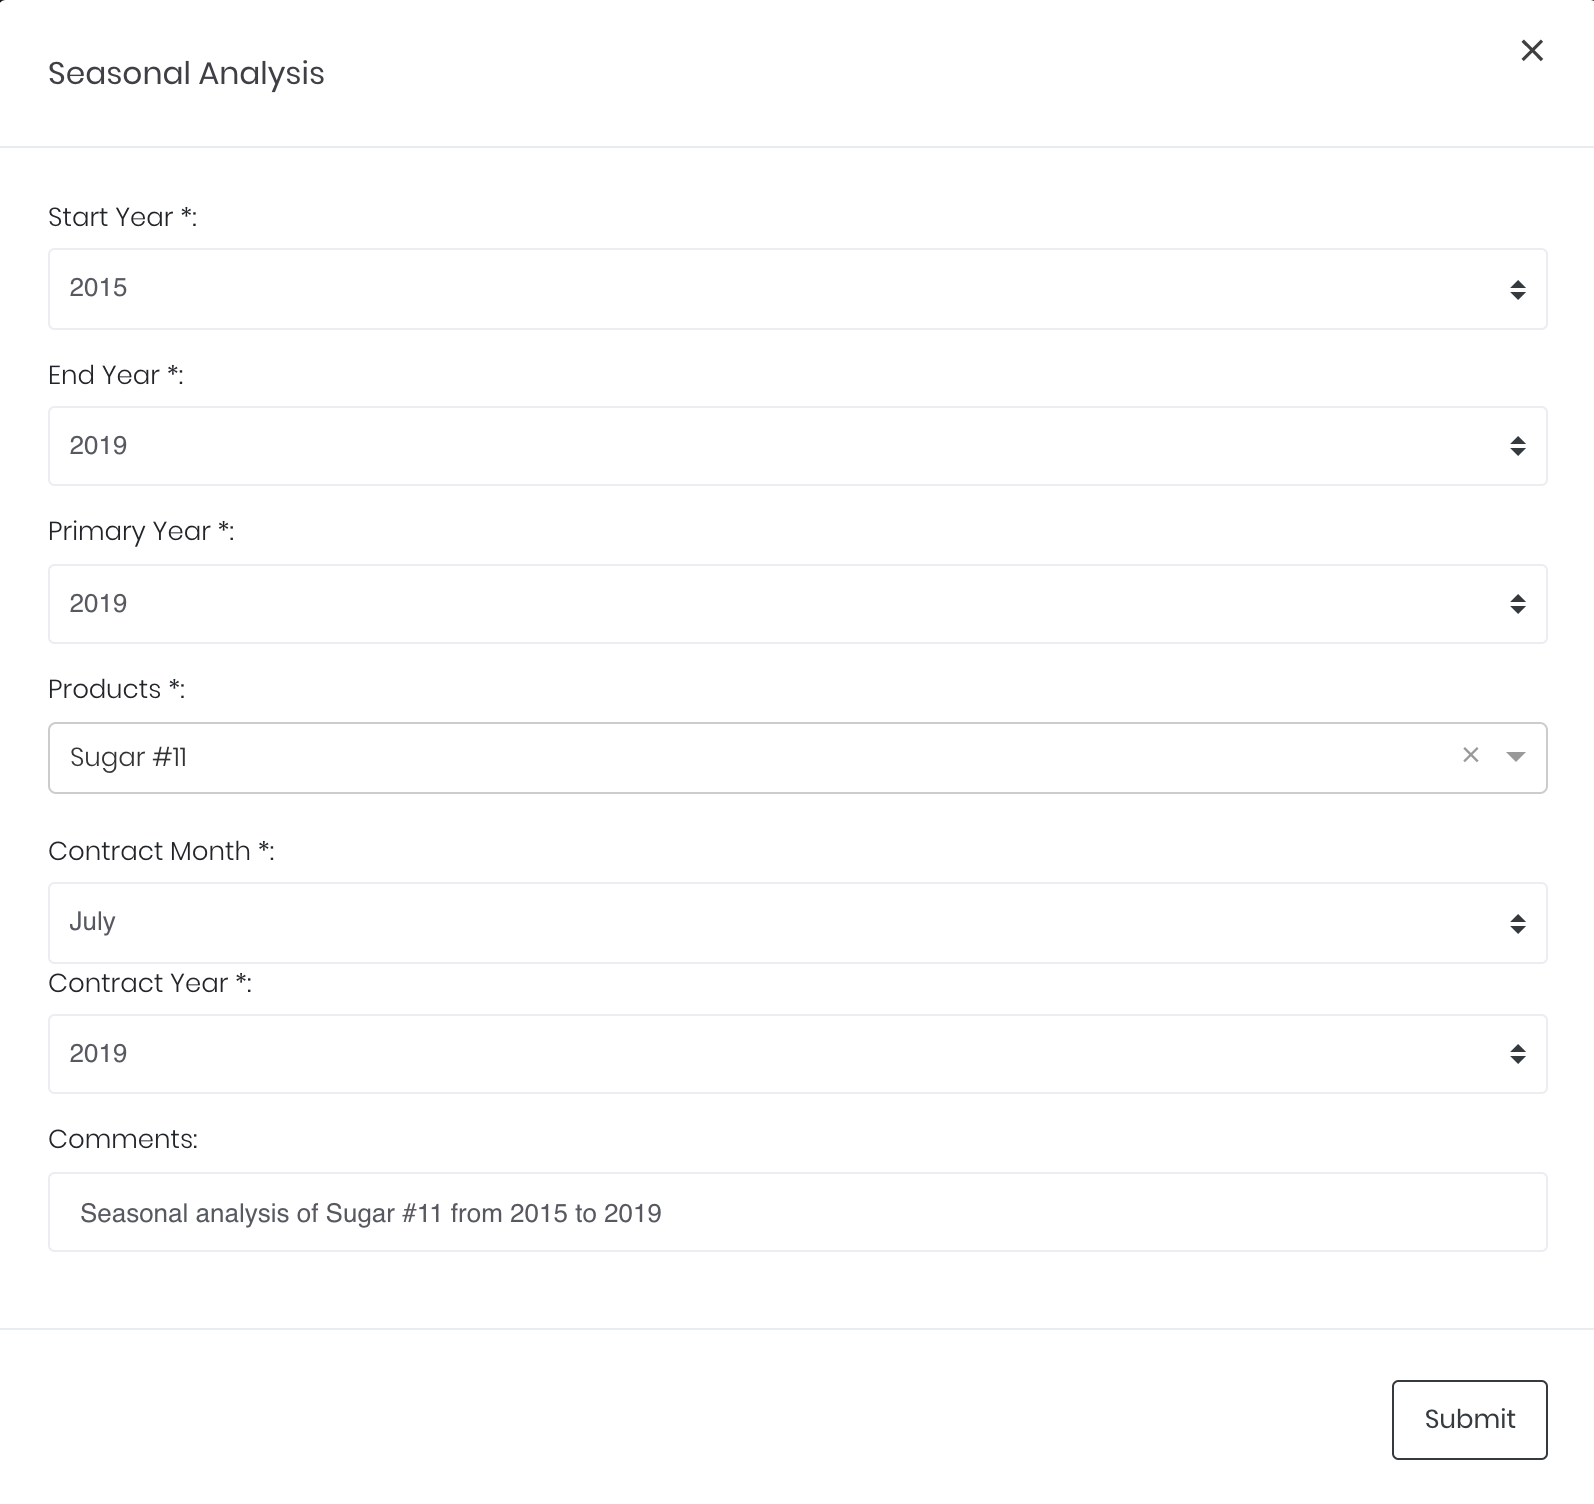
Input
| Description | Type | Example | |
|---|---|---|---|
| Start Year | Start year for inclusion into seasonal analysis. | Year | 2015 |
| End Year | End year for inclusion into seasonal analysis. | Year | 2019 |
| Primary Year | Primary year to be examined against the product's seasonality data. | Year | 2019 |
| Product | Product name. | Product (Selection) | Sugar #11 |
| Contract month. | Month | July | |
| Contract year. | Year | 2019 | |
| Comments | Useful for documentation purposes or for settings description. | Text | - |
Output
| Name | Description | Type |
|---|---|---|
| Primary Time-series | Product time-series in primary year. | Plot |
| Seasonality data | Displays the minimum and maximum price on each calendar date for the years selected for analysis, as well as a time-series of the average price and current price on each date of different years. | Plot |
Example
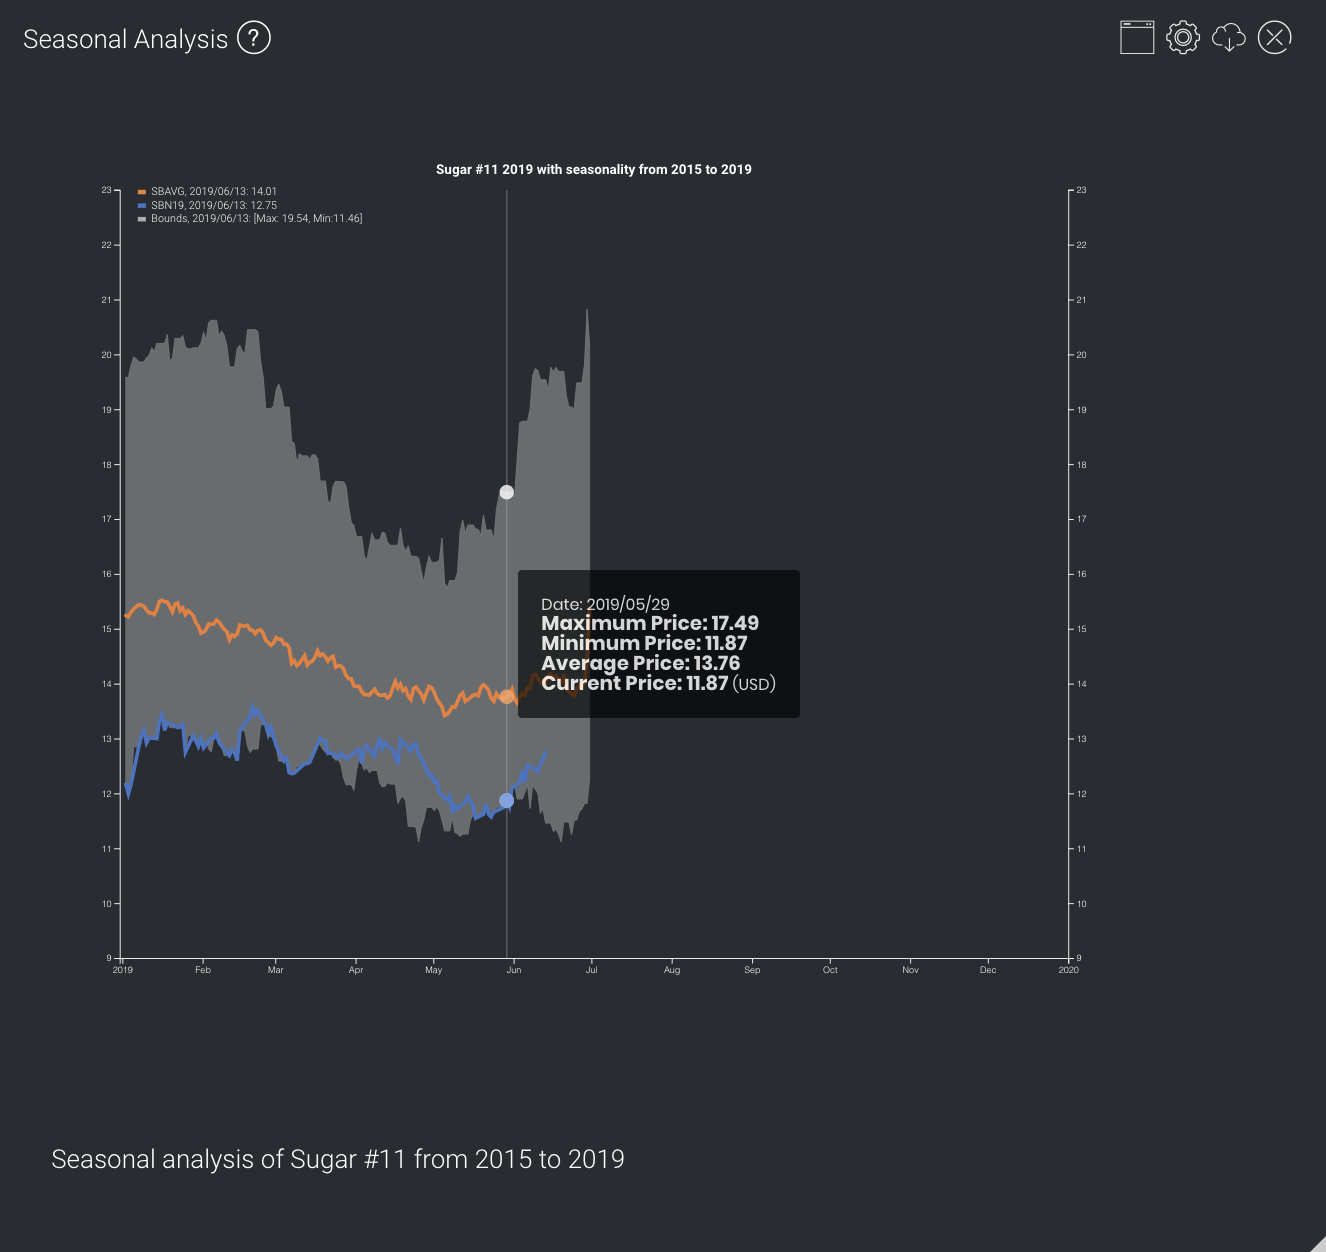
Sugar is usually cheaper in summer (due to higher supply), and seems to be underperforming in 2019.
Functionality
Displayed below are some noteworthy user interactions you can find on this application.
| Name | Description | Interaction |
|---|---|---|
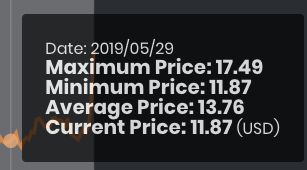
| Tooltip lines (Vertical) | Show cursor position along the X-axis ('Date'). Circles appear on the various time-series, and a tooltip displays all the price values (minimum, maximum, average and current).
| Plot Element |
| Legend, Bounds | The minimum and maximum of the product's value on the latest date in previous years are shown in the legend at the top of the Y-axis on the left. | Plot Element |
Click to access: