Portfolio Total Equity Model
- MAF Intern (Unlicensed)
- IT Support
- Christabel Chiang (Unlicensed)
Return to Overview
About
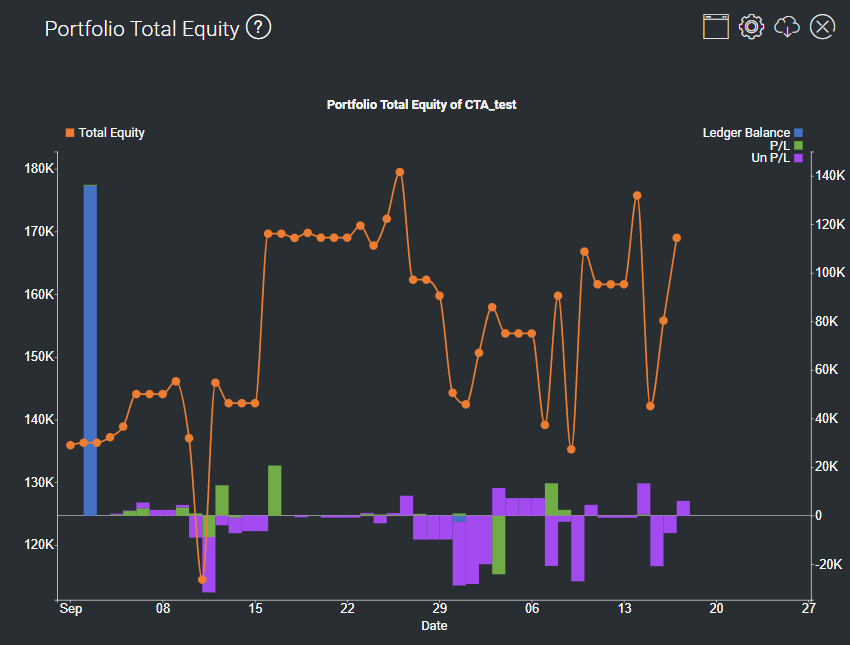
The Portfolio Total Equity model shows the total equity in a portfolio over time, as well as various components accounting for any changes – which includes ledger balance and realised & unrealised profit/losses.
Guide
Name | Image/Description |
|---|---|
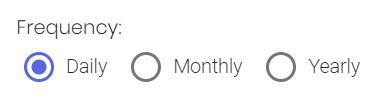
Frequency |
Select the resolution at which total equity data are to be viewed. |
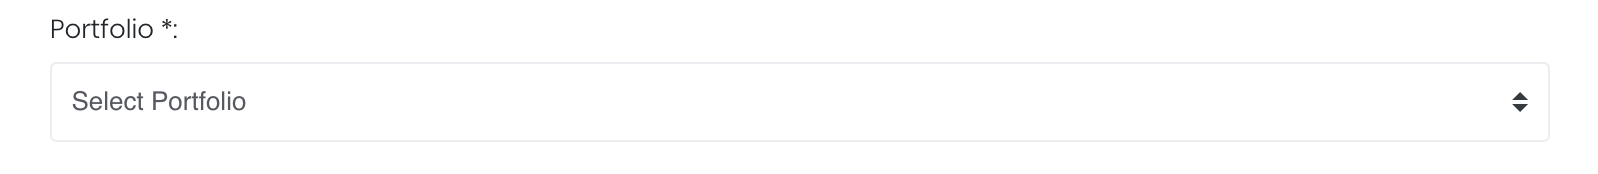
Portfolio |
Select a portfolio of interest. |
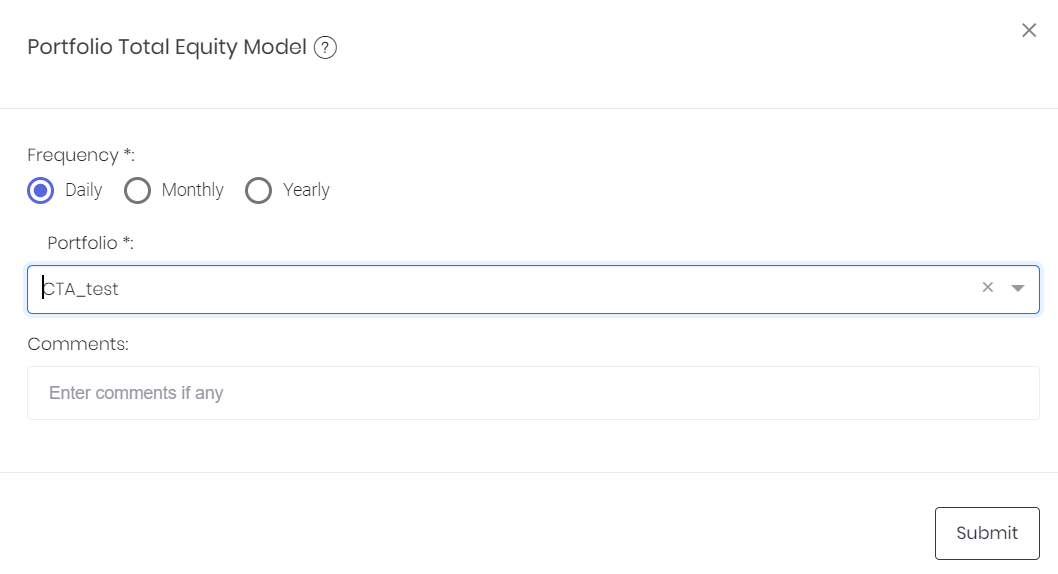
Comments |
The inserted comments will be displayed at the bottom of the application. This can be useful for documentation purposes or for settings description. |

Input
Name | Description | Type | Example |
|---|---|---|---|
Frequency | Resolution at which data are viewed. | Selection | Daily |
Portfolio | Portfolio to be analysed. | Portfolio (Selection) | CTA_Test |
Comments | Useful for documentation purposes or for settings description. | Text | - |
Output
Name | Description | Type |
|---|---|---|
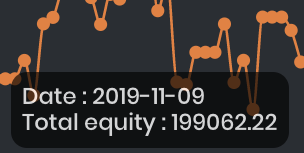
Total Equity Time-Series | The total equity of the portfolio is shown as a time-series, its unit range is shown on the left Y-axis, against 'Date' on the X-axis. | Plot |
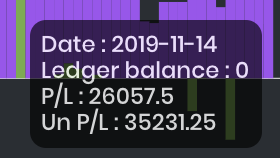
Component Bar Charts | The components accounting for changes in total equity are shown as bar charts; their unit range is shown on the right Y-axis, against 'Date' on the X-axis. The components are: Ledger Balance: Changes to total equity due to fund in/out, taxes, commission etc. (recorded by user in General Ledger). P/L: Realised Profit/Loss Un P/L: Unrealised Profit/Loss | Plot |
Example
Functionality
Displayed below are some noteworthy user interactions you can find on this application.
Name | Description | Interaction |
|---|---|---|
Multi Tooltip Lines (Vertical and Horizontal) | Mouse-over the graph and a tooltip will appear, displaying the values along the X-axis ('Date') and the Y-axis ('Total Equity' or component values).
| Plot Element |
Click to access: