Portfolio Performance Table
- Herougan No (Unlicensed)
- MAF Intern (Unlicensed)
- IT Support
- Christabel Chiang (Unlicensed)
Return to Overview
About
The Portfolio Performance Table provides a summary of the performance of a trader's portfolio – including various returns measures, and other performance measures such as alpha. The measures may be benchmarked against an index or commodity of the user's choice (1 column shows statistics for the portfolio, and another for the benchmark). Please refer to 'Output' below for a more comprehensive description of each performance measure (Please also refer to the Portfolio Statistics Table for other statistics of portfolio performance).
Guide
Name | Image/Description |
|---|---|
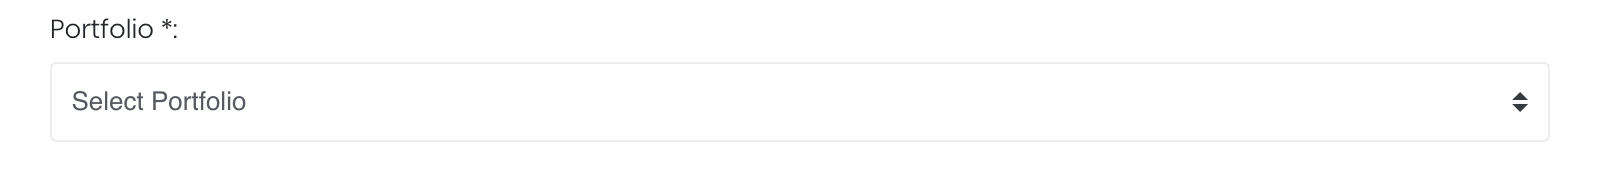
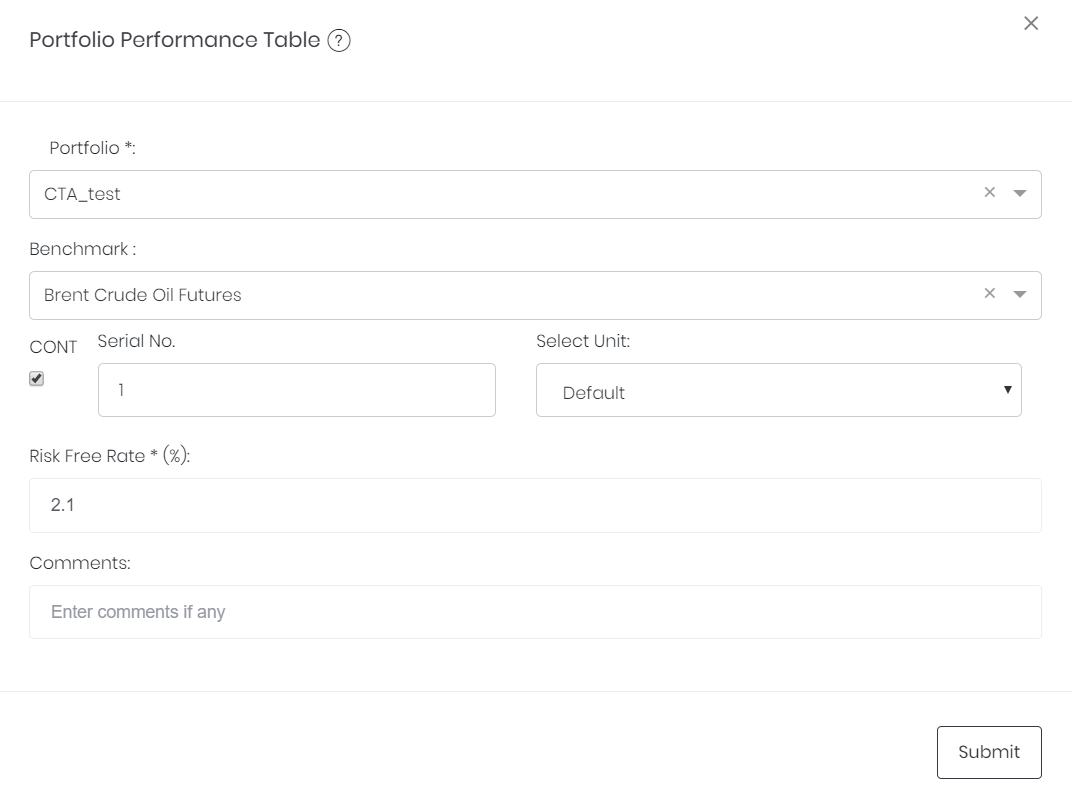
| Portfolio |
Select a portfolio of interest. |
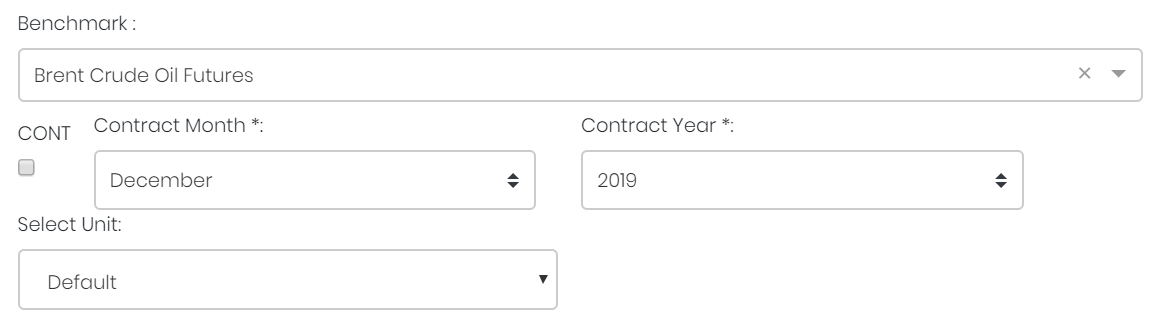
| Benchmark |
Select a benchmark. (The benchmark's summary statistics are also shown, and can be compared against that of the portfolio.) If it is a future continuous contract, tick checkbox 'CONT' and fill in the 'Serial No.'. For more information, please refer to Futures Continuous Contract Data Setting. Otherwise, select the 'Contract Month' and 'Contract Year' for the product(s) of interest. |
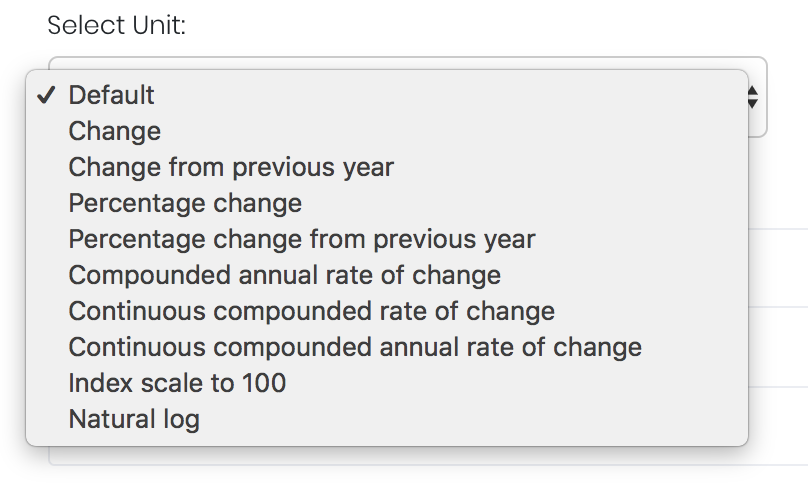
| Select Unit |
Select the unit for the product. You may leave it as "Default". For more information about other units, please refer to Select Unit (Data Transformation Tool). |
| Risk Free Rate (%) |
The risk-free interest rate is inserted by the user and is used in calculating various performance statistics. (The current T-bill rate is the suggested risk-free rate.) |
| Comments |
The inserted comments will be displayed at the bottom of the application. This can be useful for documentation purposes or for settings description. |

Input
Name | Description | Type | Example |
|---|---|---|---|
| Portfolio | Portfolio to be analysed. | Portfolio (Selection) | ABC |
| Benchmark | Product to be used as a benchmark. | Product Name | Brent Crude Oil Futures |
| Contract month. | Month | July | |
| Contract year. | Year | 2019 | |
| Continuous contract (for more information, please refer to Futures Continuous Contract Data Setting). | Checkbox | - | |
| Serial number of starting futures contract (for more information, please refer to Futures Continuous Contract Data Setting). | Numerical Value | 1 | |
| Unit (for more information, please refer to Select Unit (Data Transformation Tool)). | Unit | Default | |
| Risk Free Rate (%) | The risk-free interest rate (inserted by user) to be used in calculating performance statistics. | Numerical Value | 2.1 |
| Comments | Useful for documentation purposes or for settings description. | Text | - |
Output
Name | Description | Formula |
|---|---|---|
| 1 Year R (%) | Total compounded return for the past 12 months. | (RoRt*RoRt-1*RoRt-2*...RoRt-11 -1) *100%, |
| 3 Year R (%) | Total compounded return for the past 36 months. | (RoRt*RoRt-1*RoRt-2*...RoRt-35 -1) *100%, where t = current month |
| Compounded Monthly R (%) | Average compounded return per 1 month (across all months). | ((RoR1*RoR2*RoR3*...RoRN)1/N -1) *100% |
| Compounded Annual R (%) | Average compounded return of each year (across all years). | ((1 + Compounded Monthly R)12 -1) *100% |
| Monthly Mean R (%) | Average of monthly returns. | (R1+R2+ R3+...RN) / N |
| Total Compound R (%) | Total compounded rate of return. | (RoR1*RoR2*RoR3* …RoRN - 1) *100% |
| YTD R (%) | Year-to-date return, which is the total compounded return since first month of the current year. | ((RoRs+1*RoRs+2*...RoRN-s)1/(N-s) -1) *100%, where s = last month of previous year |
| Alpha (%) | Excess return of a portfolio, not accounting for returns correlated with overall market movements (tracked by a benchmark such as S&P). | (M - Beta* BM)*100% |
| Beta | Correlation between the performance of a portfolio and that of a market benchmark (such as S&P). | ∑i (Ri - M)(Bi- BM)/ ∑i (Bi- BM)2 |
| Risk Free Rate (%) | Risk-free rate (inserted by user). | 2.1 |
Formula Symbols:
R = return, RoR = rate of return = 1 + (R/100%), N = number of months, M = mean return, Bi = benchmark return for a given month, BM = average benchmark return
Example
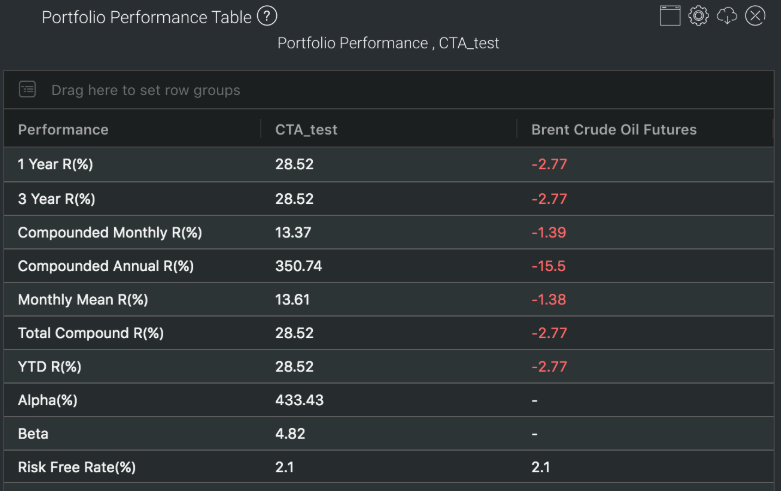
Aren't these returns impressive? But please remember that past performance may not be indicative of future results. 
Functionality
Please refer to Table Settings for table functionalities.
Click to access: