Correlation Matrix
- IT Support
- Snakehead
- e0031959 (Unlicensed)
Return to Overview
To access the quantitative model/report, click on 'Dashboard' from the navigation sidebar on the left. Select the model/report from the drop-down list and click 'Create'. Click on the 'Settings' button (gear icon) at the top right corner of the model to set up your model/report.
About
The Correlation Matrix displays a table showing the correlation coefficient(s) between products in the selected portfolio (the constituent assets in the portfolio are selected by the user in the Create Portfolio section). The Correlation Matrix can be used to summarise a large amount of data about the relationship between assets in the portfolio. Furthermore, the grids are colour-coded based on the correlation coefficient to enable the user to identify patterns more easily.
This model can help the user identify whether the risks of each asset in his/her portfolio will cancel or reinforce one another during market swings.
Guide
| Name | Image/Description |
|---|---|
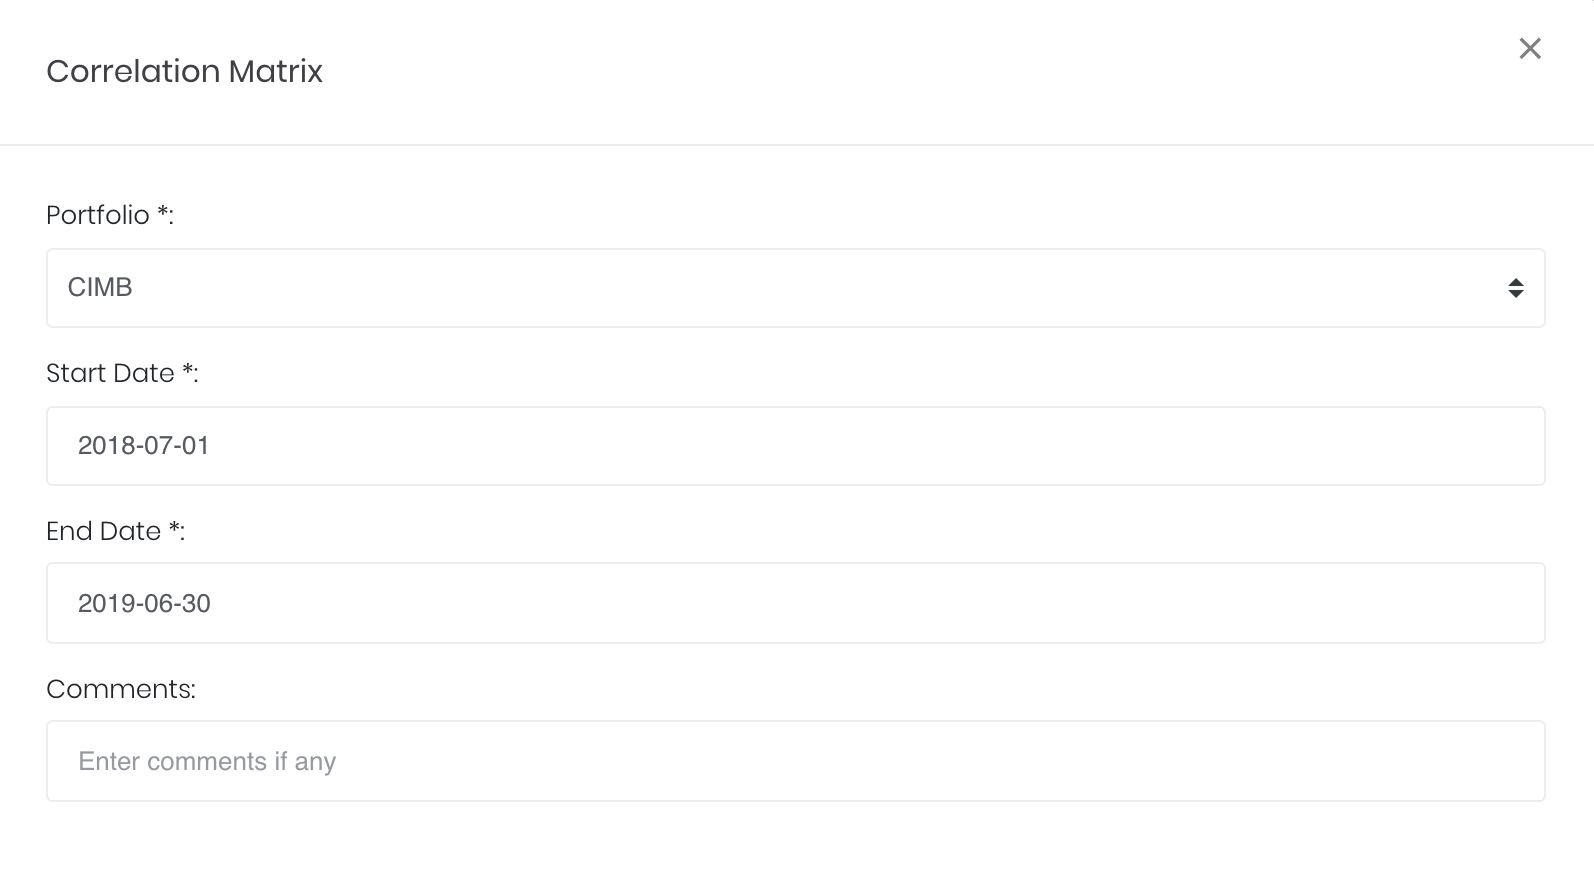
| Portfolio |
Select the portfolio of interest. |
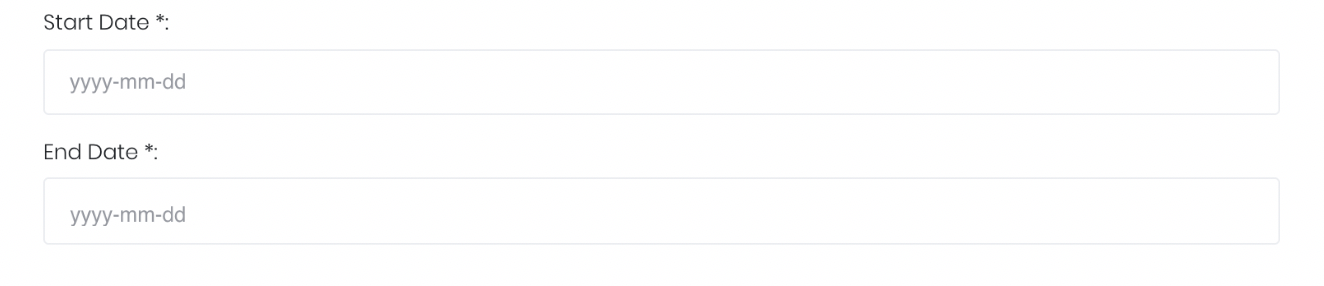
| Duration |
Select the start and end date for the data in the portfolio to be used for analysis. |
| Comments |
The inserted comments will be displayed at the bottom of the application. This can be useful for documentation purposes or for settings description. |

Input
| Name | Description | Type | Example |
|---|---|---|---|
| Portfolio | Portfolio selected. | Portfolio (Selection) | ABC |
| Start Date | Start of product time-series. | Date (YYYY-MM-DD) | 2015-06-01 |
| End Date | End of product time-series. | Date (YYYY-MM-DD) | 2019-06-14 |
| Comments | Useful for documentation purposes or for settings description. | Text | - |
Output
Name | Description | Type |
|---|---|---|
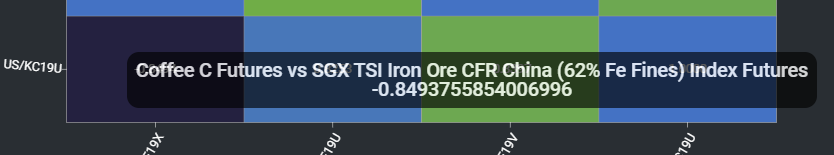
| Correlation Table | Displays the correlation between the two assets in the portfolio. The deeper the shade of green is, the more negatively correlated they are. The deeper the shade of blue is, the more positively correlated they are. | Table |
Example
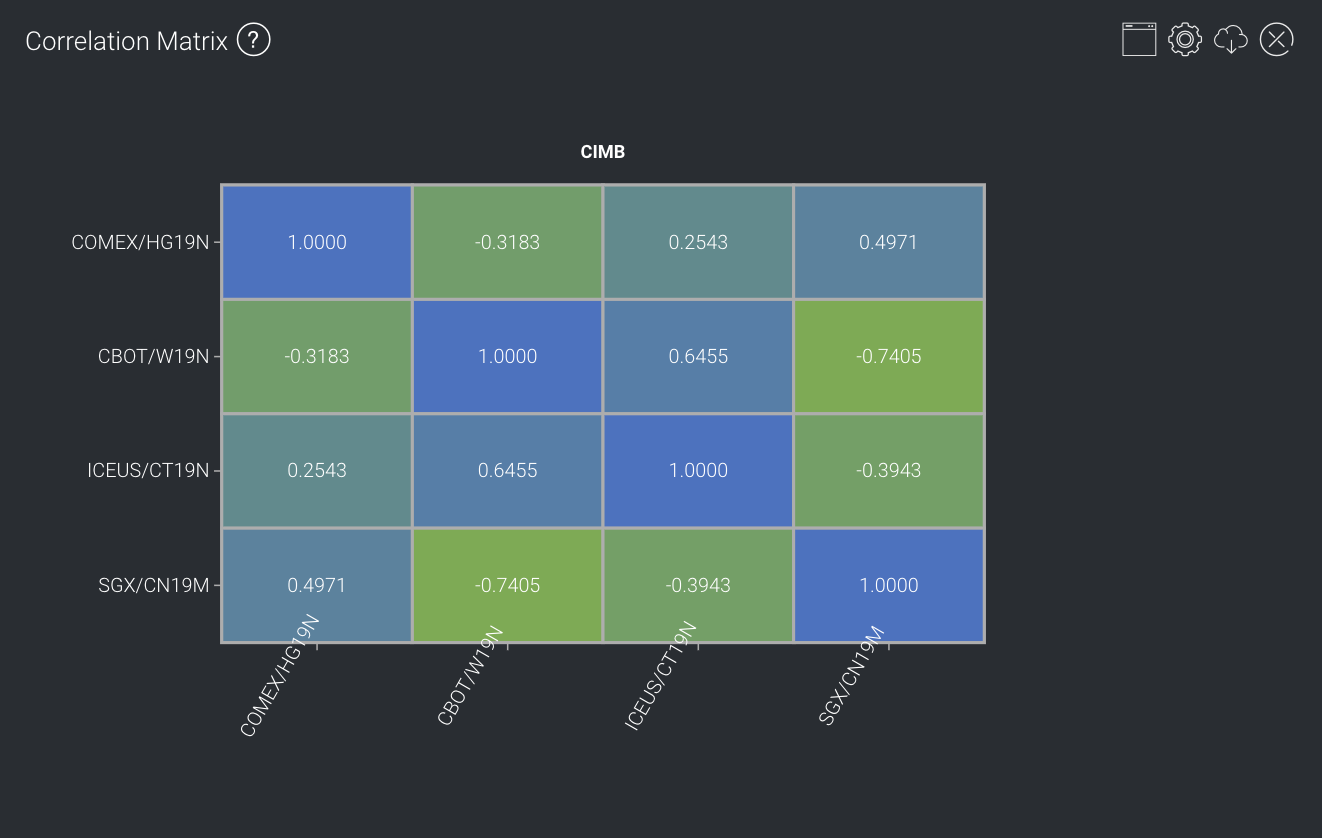
In this portfolio of 4 assets, it can be seen that there is a strong negative correlation between SGX/CN and CBOT/W (r = -0.7405), and a somewhat positive correlation between ICEUS/CT and CBOT/W (r = 0.6455) as well as SGX/CN and COMEX/HG (r = 0.4971).
Functionality
Displayed below are some noteworthy user interactions you can find on this application.
Name | Description | Interaction |
|---|---|---|
| Table Cell Mouse-Over | Mouse-over the cell of the two compared assets, and the full product names as well as a more precise value of their correlation will be displayed.
| Mouse-over |
Click to access: