Portfolio VAMI Series Model
- MAF Intern (Unlicensed)
- IT Support
- Christabel Chiang (Unlicensed)
Return to Overview
About
Value-Added Monthly Index (VAMI) is a method of tracking the return on an investment over a given period of time and is calculated based on a hypothetical $1,000 investment from the beginning (assuming re-investment). Based on the past returns data of a portfolio, the Portfolio VAMI Series model displays the value of the investment at different points in time. The user may also choose to include a benchmark (such as an index or commodity), against which the performance of the portfolio can be compared.
Guide
| Name | Image/Description |
|---|---|
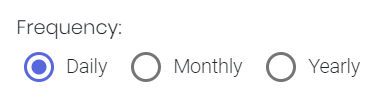
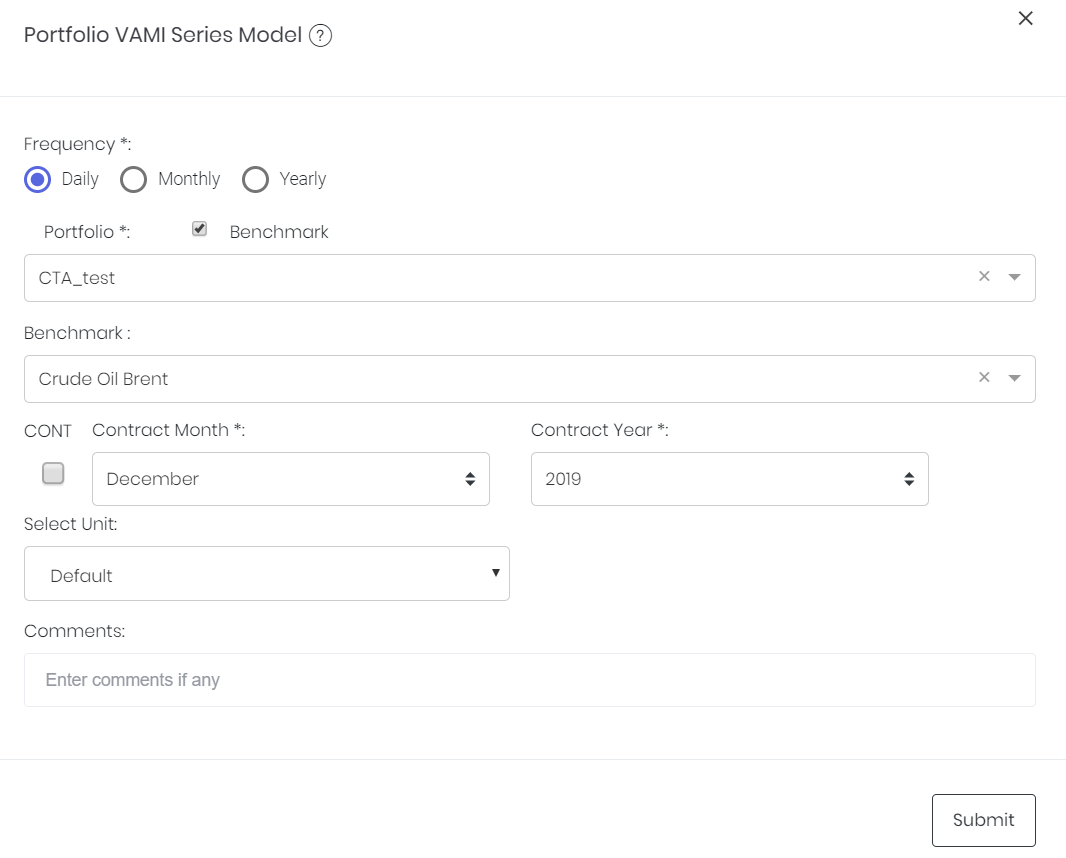
| Frequency |
Select the resolution at which returns data are to be viewed. |
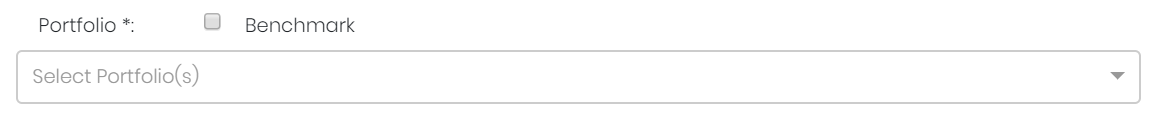
| Portfolio |
Select a portfolio of interest, and whether to include a benchmark. |
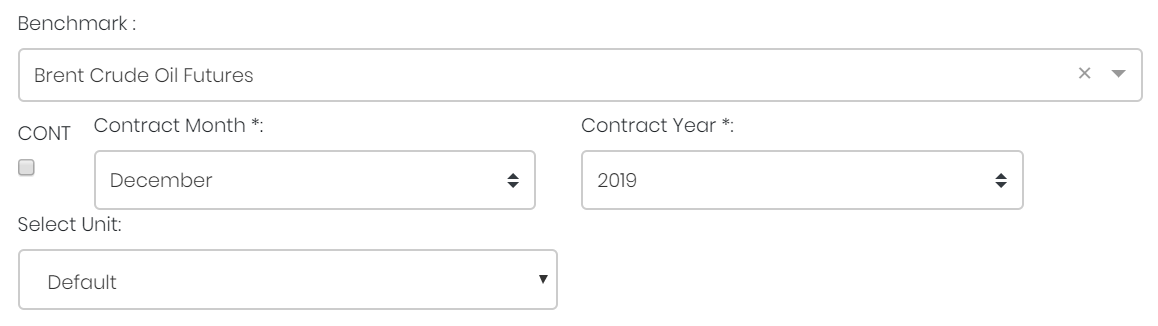
Benchmark (optional) |
Select a benchmark (against which the portfolio is compared). If it is a future continuous contract, tick checkbox 'CONT' and fill in the 'Serial No.'. For more information, please refer to Futures Continuous Contract Data Setting. Otherwise, select the 'Contract Month' and 'Contract Year' for the product(s) of interest. |
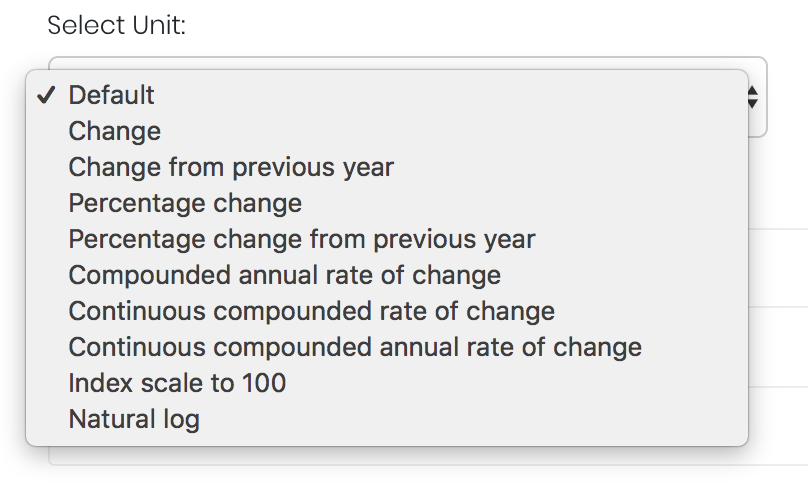
| Select Unit |
Select the unit for the product. You may leave it as "Default". For more information about other units, please refer to Select Unit (Data Transformation Tool). |
| Comments |
The inserted comments will be displayed at the bottom of the application. This can be useful for documentation purposes or for settings description. |
Input
Name | Description | Type | Example |
|---|---|---|---|
| Frequency | Resolution at which returns data are viewed. | Selection | Daily |
| Portfolio | Portfolio to be analysed. | Portfolio (Selection) | CTA_Test |
| Benchmark | Product to be used as a benchmark. | Product Name | Sugar #11 |
| Contract month. | Month | July | |
| Contract year. | Year | 2019 | |
| Continuous contract (for more information, please refer to Futures Continuous Contract Data Setting). | Checkbox | - | |
| Serial number of the starting futures contract (for more information, please refer to Futures Continuous Contract Data Setting). | Numerical Value | 1 | |
| Unit (for more information, please refer to Select Unit (Data Transformation Tool)). | Unit | Default | |
| Comments | Useful for documentation purposes or for settings description. | Text | - |
Output
| Name | Description | Type |
|---|---|---|
| Portfolio's Value-Added Monthly Index (VAMI) | Displays the value that a hypothetical initial investment of $1000 would have (Y-axis) on any date (X-axis). Shown as an orange shaded area. | Plot |
| Benchmark Time-Series | Displays the value of the hypothetical $1000 investment if it is put into the benchmark instead. Same axes as above; shown as a blue time-series. | Plot |
Example
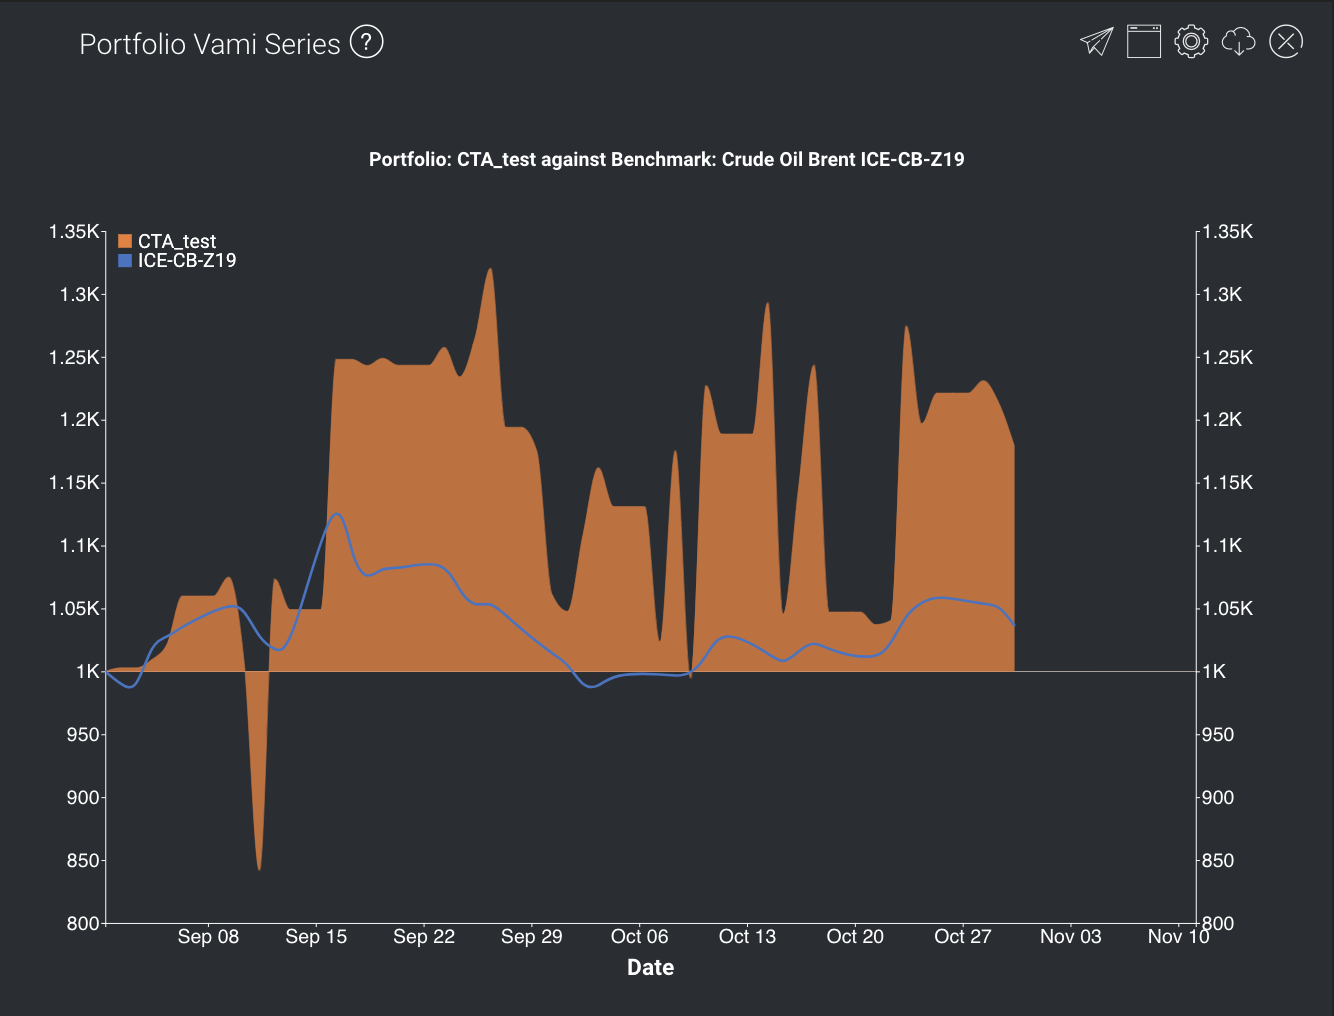
This portfolio's value seems to be fluctuating quite a bit, but investors would generally have made gains if they invested before September.
Functionality
Displayed below are some noteworthy user interactions you can find on this application.
Name | Description | Interaction |
|---|---|---|
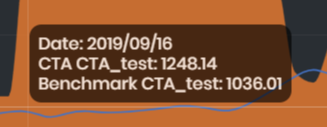
| Multi Tooltip Lines (Vertical and Horizontal) | Mouse-over the graph and a tooltip will appear, displaying the values along the X-axis ('Date') and the Y-axis (portfolio's VAMI and the equivalent compounded returns on benchmark).
| Plot Element |
Click to access: