Demurrage Claims Offset List
- IT Support
You can generate your Demurrage Claims Offset List without any data processing with this function. Now you will never miss out on any outstanding claims to your counterparties! A default Demurrage Claims Offset List table has been set up for you in the 'Demurrage Claims' page. You may filter the table to display claims with outstanding status or any other statuses, according to your definitions and requirements.
Alternatively, you may also use this function as a data summarisation tool (similar to that of a Pivot table in Excel) to summarise, sort, filter, reorganise, group, calculate, aggregate and analyse your data in the 'Demurrage Claims' table. Data can be organised into columns and rows with automatic calculations. In just a few clicks and dragging-and-dropping of the fields around, your work processes can be simplified and you can have access to an organised set of useful information catered to your needs.
To access the 'Demurrage Claims' page, click 'Demurrage' from the navigation sidebar on the left.
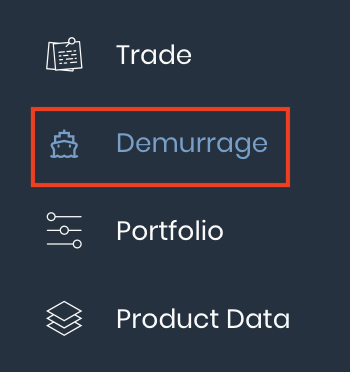
TABLE OF CONTENTS
Viewing Demurrage Claims Offset List
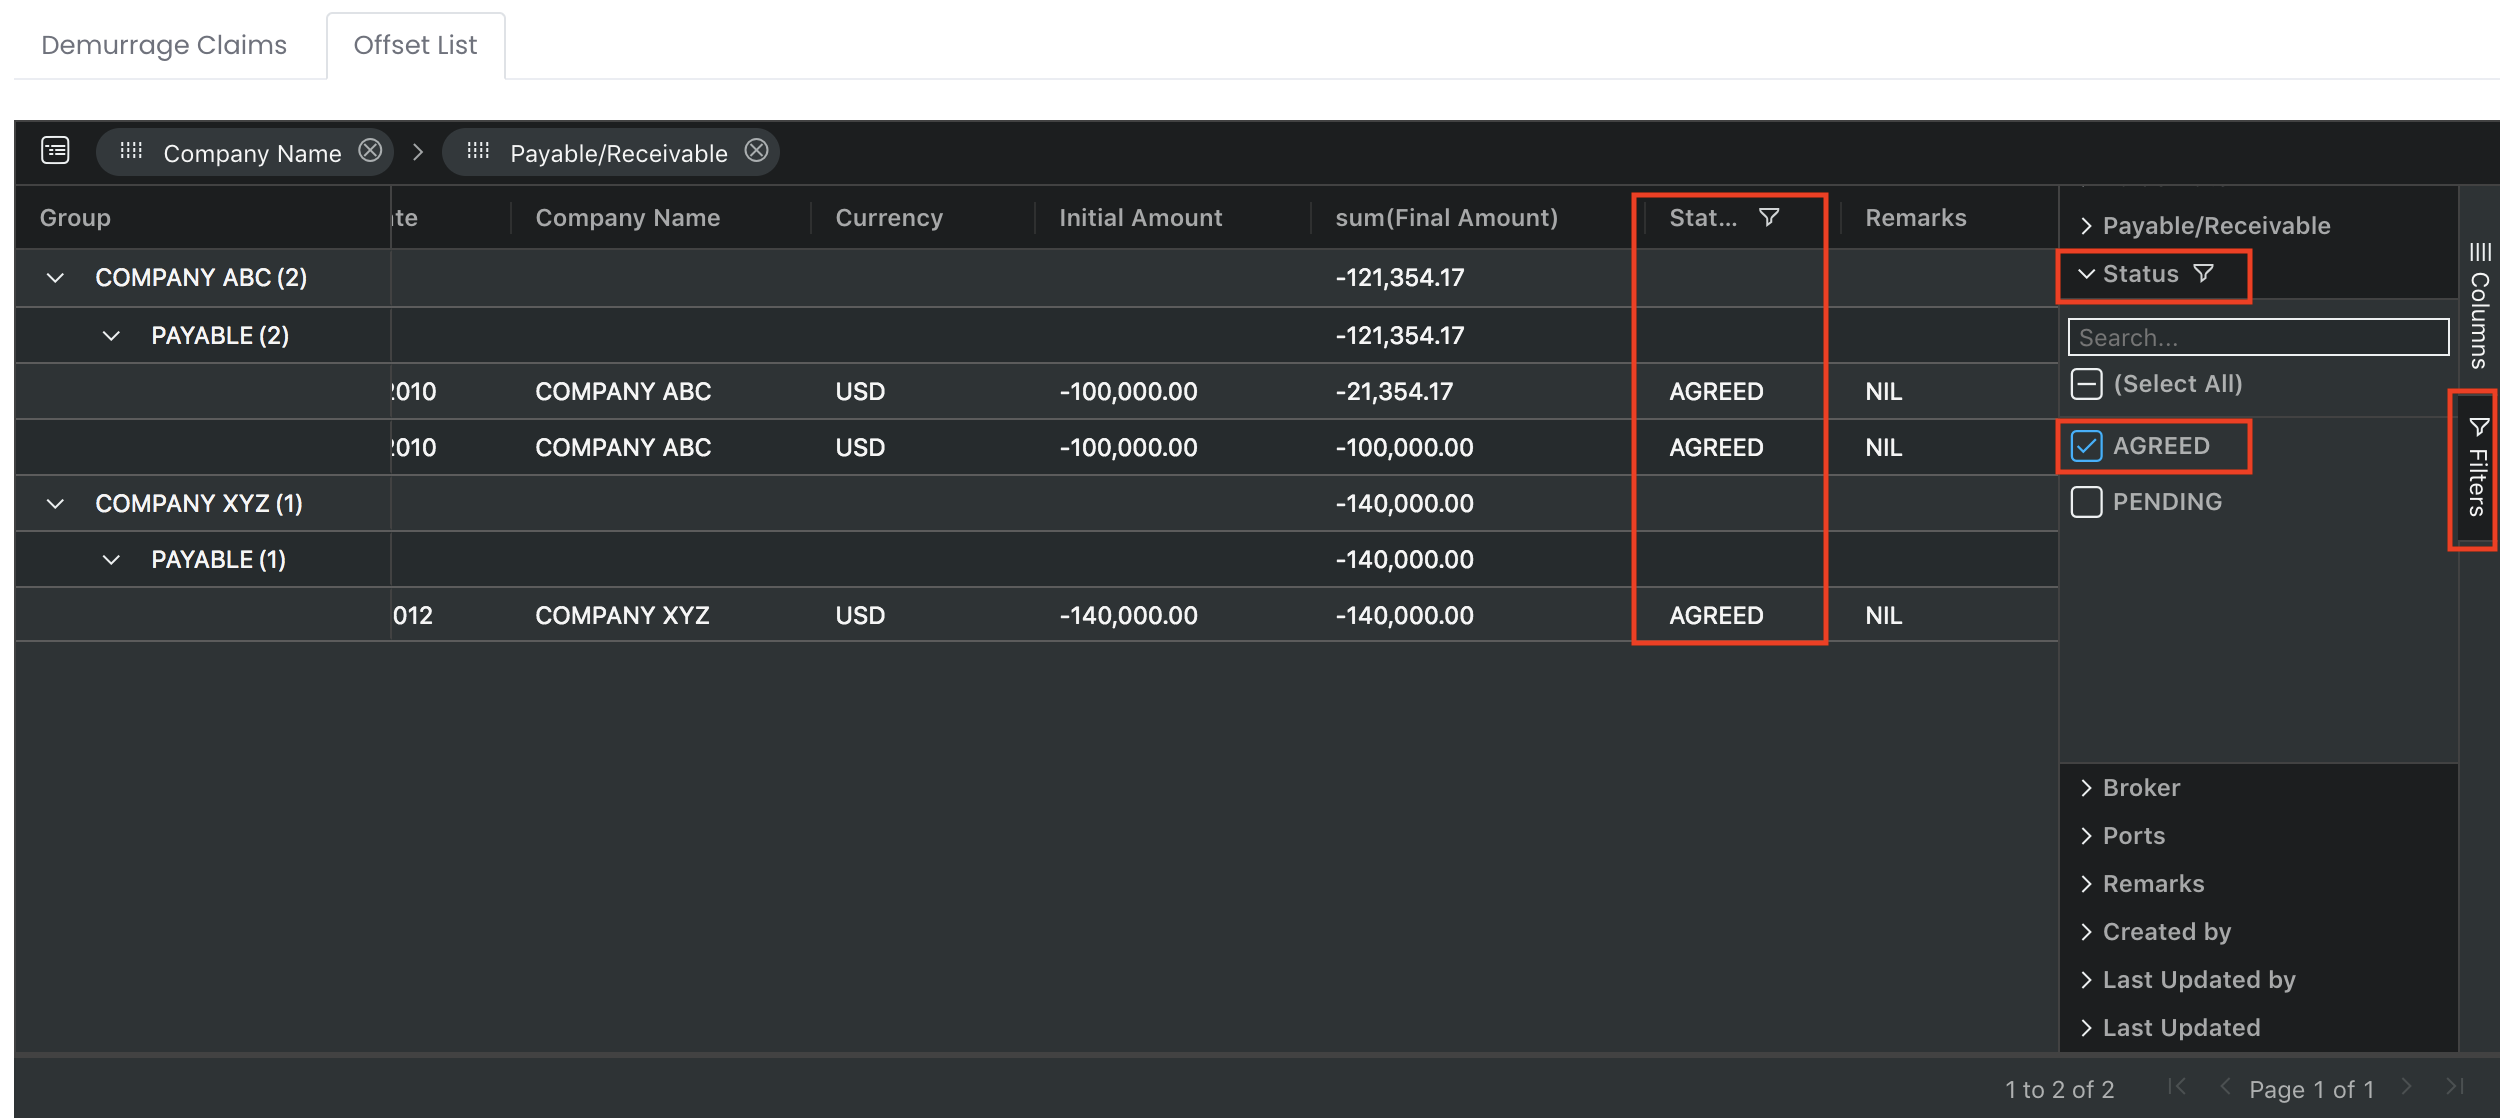
1. Click on the 'Offset List' tab at the top left corner of the 'Demurrage Claims' table to display the Demurrage Claims Offset List default table. The main data automatically filtered here are 'Company Name', 'Payable/Receivable', 'Initial Amount' and 'Final Amount'. You may refer to Adjusting Demurrage Claims Offset List if you want to filter otherwise.
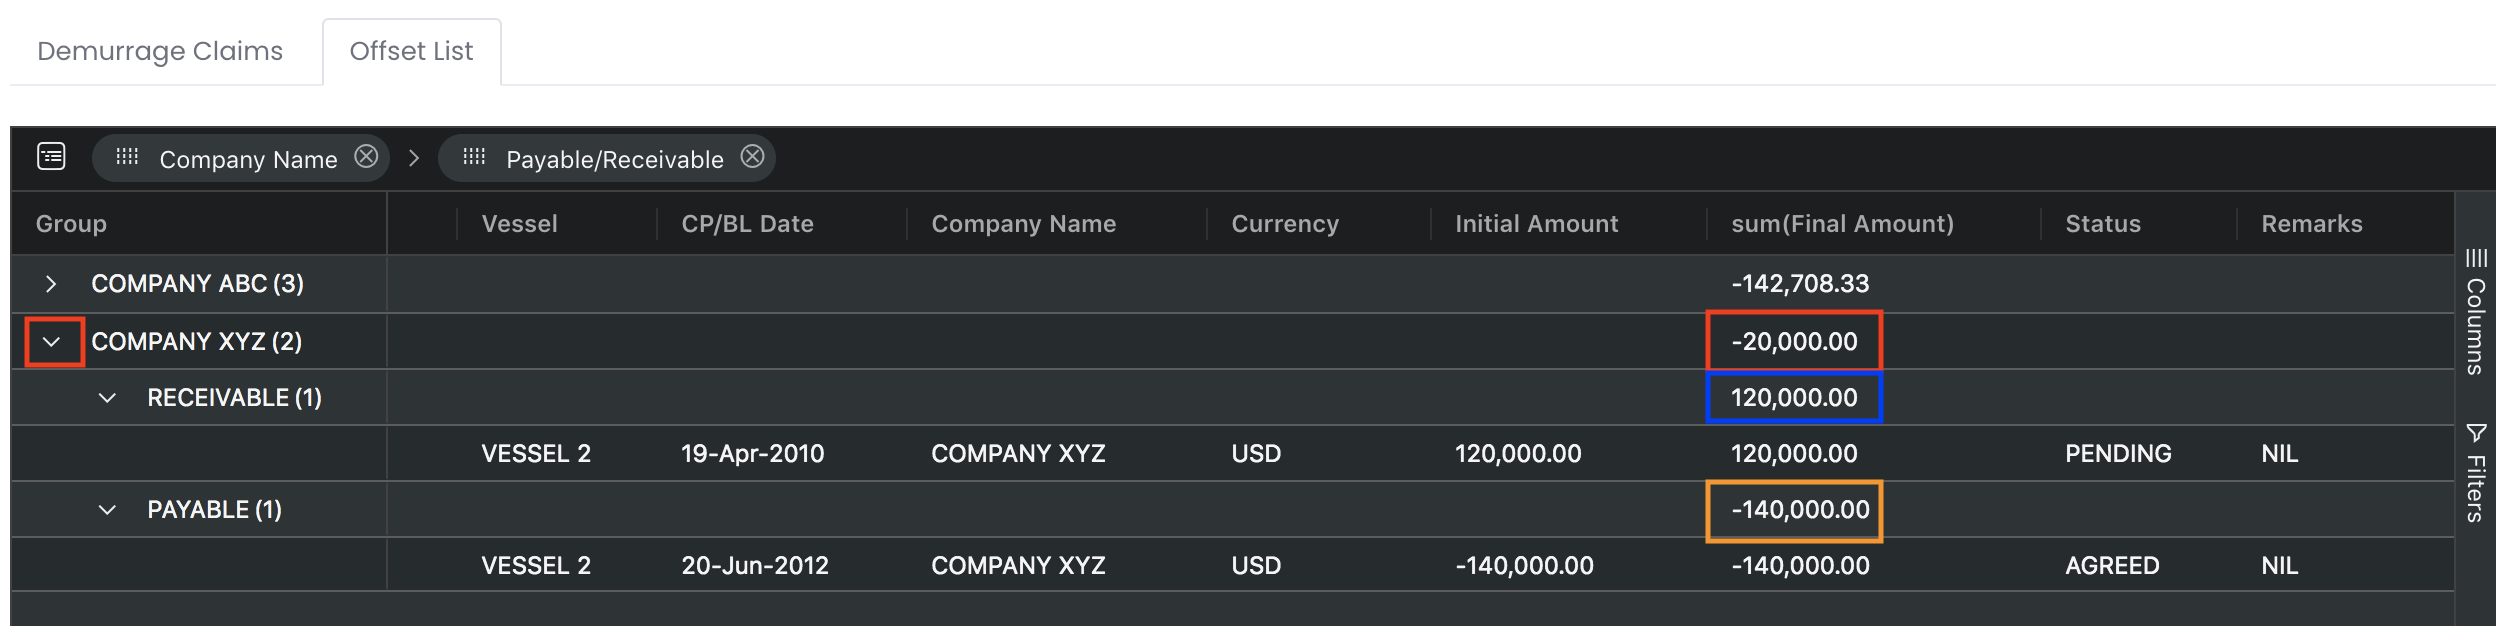
Initial Amount, Initial Payable, Initial Receivable, Initial Net Amount, Final Amount, Payable, Receivable and Net Amount are auto summed up.
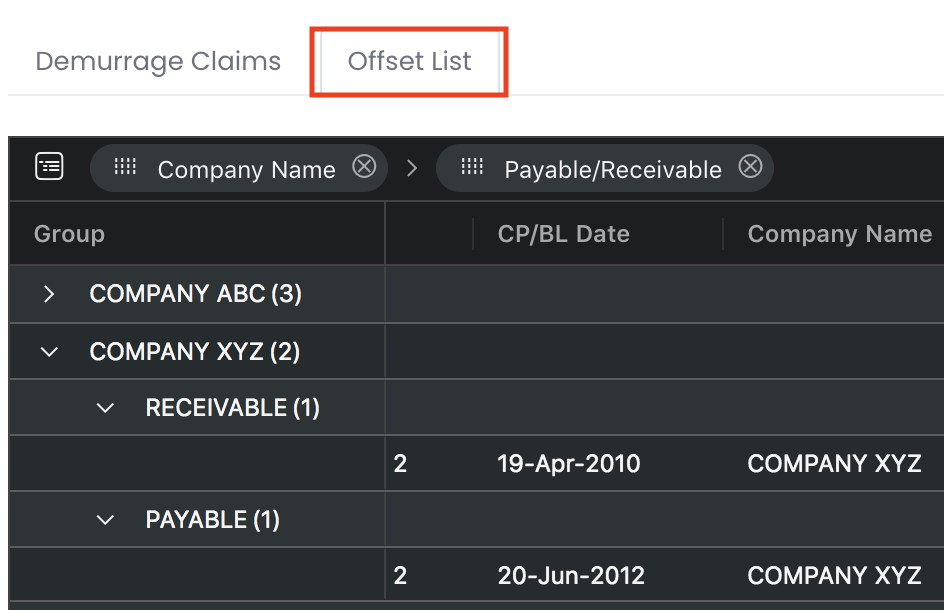
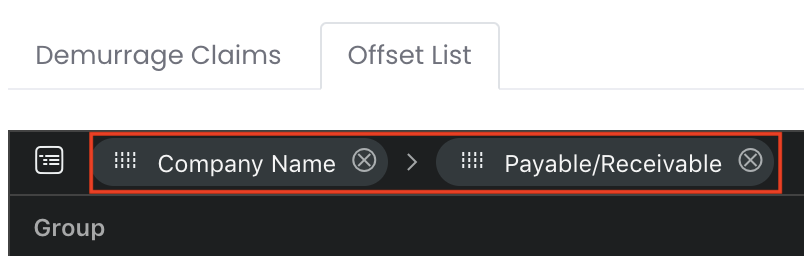
2. The 'Company Name' and 'Payable/Receivable' columns are dragged-and-dropped onto the top of the pivot table, indicating that the table will be grouped by rows according to these column headers (displayed on the left in the table). You are free to drag-and-drop or close (click on the 'X' icon) any column headers at the top of the table to organise the table according to your needs.
3. Click on the arrow next to the 'Company Name' (under 'Group') to display the data (individual, summary or aggregated) according to the setting. In this example, we will be able to view the initial and final payable and receivable amounts between the relevant parties and offset amount here. We can see that Company XYZ has a final receivable amount of USD120,000 and final payable amount of USD140,000. These amounts will be aggregated and displayed as USD20,000 at the top row (summary) of Company XYZ. With this function, you do not need to process any data and can view all your outstanding claims at a glance!
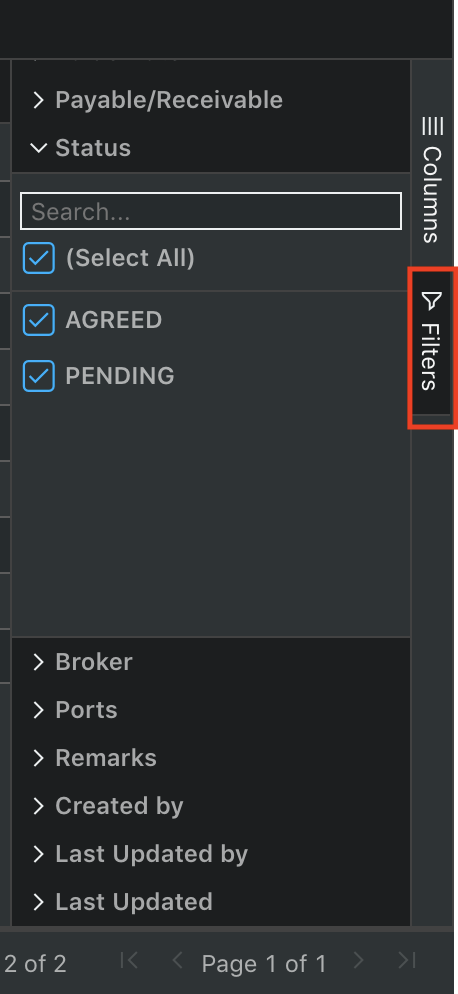
4. If you want to filter the data in your Demurrage Claims Offset List according to your needs, click on the 'Filters' button at the right corner of the table to display the filter panel. In this example, the payable and receivable amounts could have different 'Status'. To only show claims with the status, "AGREED", you can click on the drop-down list for 'Status' in the filter panel and untick "PENDING". The Demurrage Claims Offset List will be automatically filtered and display claims with the 'Status', "AGREED" according to your setting.
Adjusting Demurrage Claims Offset List
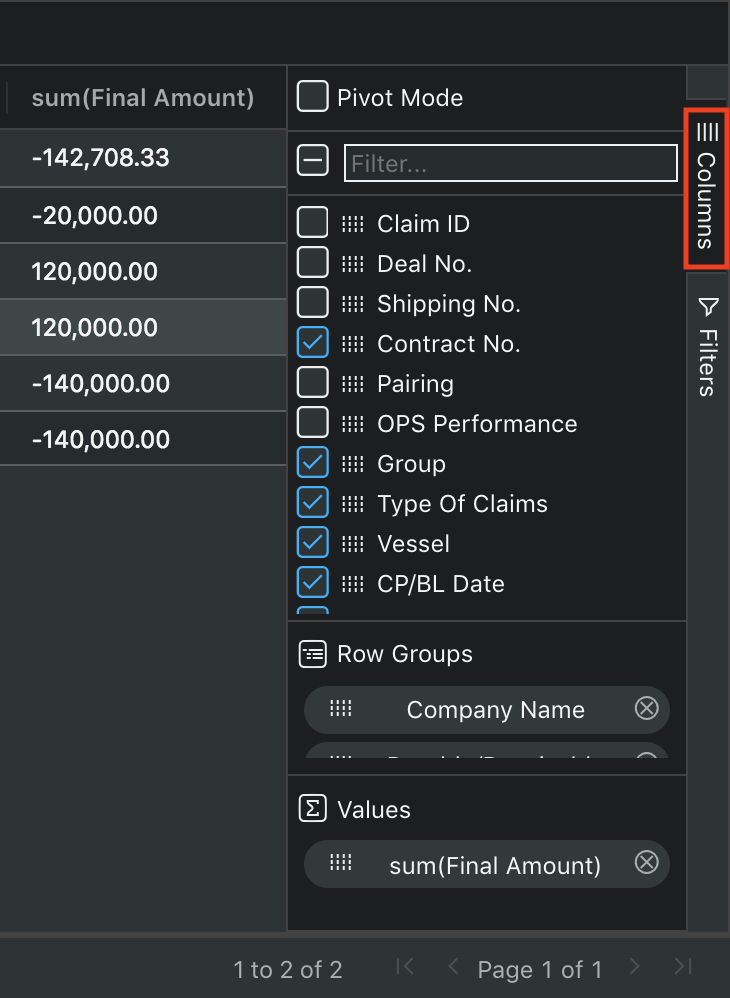
1. To adjust your Demurrage Claims Offset List, you can click on the 'Columns' button at the right corner of the table to display the pivot table panel. Tick/untick the checkbox(es) to display the column header(s) accordingly.
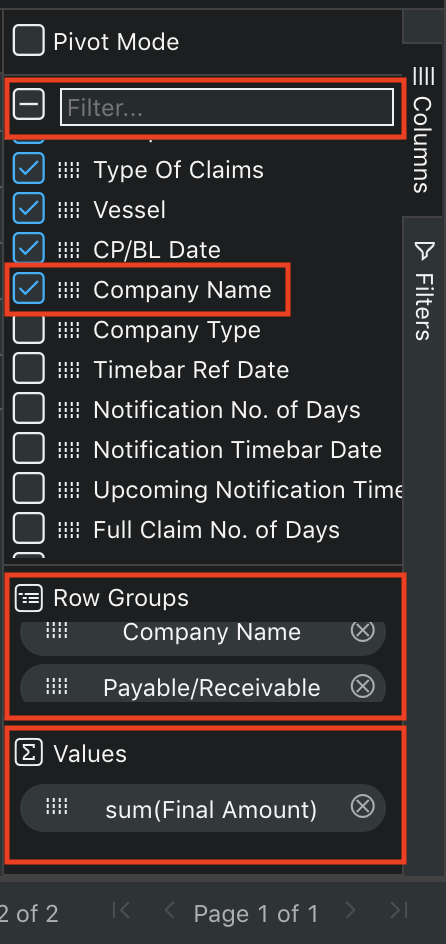
2. You can choose which column(s) to be included into the group (which will be displayed in rows) by clicking the icon ![]() next to the column header and dragging-and-dropping it into the 'Row Groups' panel. For example, 'Company Name' and 'Payable/Receivable'. You can switch the positioning of the column headers freely, and can use the filter function and key in your input to filter the column header(s).
next to the column header and dragging-and-dropping it into the 'Row Groups' panel. For example, 'Company Name' and 'Payable/Receivable'. You can switch the positioning of the column headers freely, and can use the filter function and key in your input to filter the column header(s).
3. You can choose to aggregate any values by clicking the icon ![]() next to the column header and dragging-and-dropping it (for example, 'Final Amount') into the 'Values' panel. You can use the filter function and key in your input to filter the column header(s). Click on the 'Final Amount' button to determine which type of calculation you want to use ('Sum' is the default). The aggregated value will be automatically calculated and displayed at the top of all the values in the group.
next to the column header and dragging-and-dropping it (for example, 'Final Amount') into the 'Values' panel. You can use the filter function and key in your input to filter the column header(s). Click on the 'Final Amount' button to determine which type of calculation you want to use ('Sum' is the default). The aggregated value will be automatically calculated and displayed at the top of all the values in the group.
| Type | Description | Example |
|---|---|---|
| avg | Average of all the values in the group | 20,000 |
| count | Count the number of values in the group | 2 |
| first | Select the value in the first row in the group | 10,000 |
| last | Select the value in the last row in the group | 30,000 |
| max | Select the maximum value in the group | 30,000 |
| min | Select the minimum value in the group | 10,000 |
| sum | Sum of all the values in the group | 40,000 |
4. All the settings made above in the pivot table panel will be automatically reflected in the 'Demurrage Claims' table. Click on the arrow next to your column header (under 'Group') to display the data (individual, summary or aggregated) according to your setting. in this example, we will be able to view the payable and receivable amounts between the relevant parties and offset the amount as necessary.
5. You can click on the column header to sort the data in ascending or descending order, or drag-and-drop the column header to switch its positioning with other column headers. Please refer to Demurrage Table Setting for more details.
Video
(00:01) MAF Link (Demurrage Claims)
(00:50) MAF Link (Other Claims)
(01:26) Demurrage Claims Offset List