6. Creating Your Customised Dashboard
- Christabel Chiang (Unlicensed)
- IT Support
- MAF Intern (Unlicensed)
Return to Overview
After creating your portfolio(s) and capturing your trade(s) into MAF Cloud, you can begin assembling your very own 'Dashboard'!
Here you will be able to perform a wide variety of quantitative analyses on your portfolio(s) with models provided by us!
Creating MPMS Models
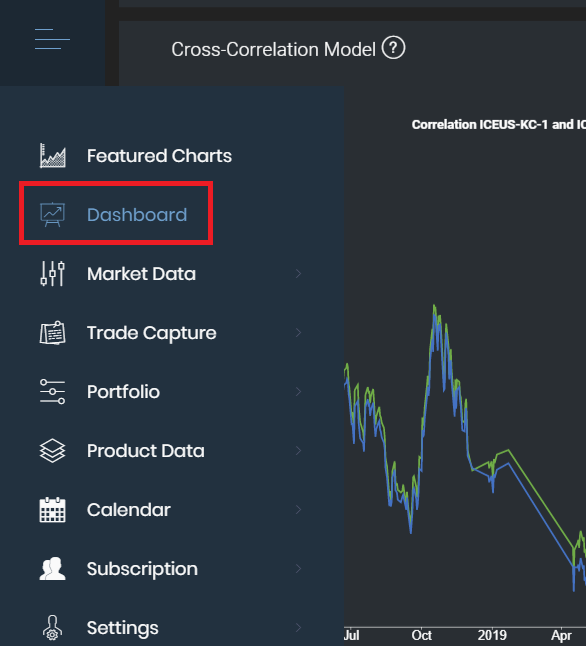
1. Click 'Dashboard' in the navigation sidebar on the left (represented by a 'chart' icon).
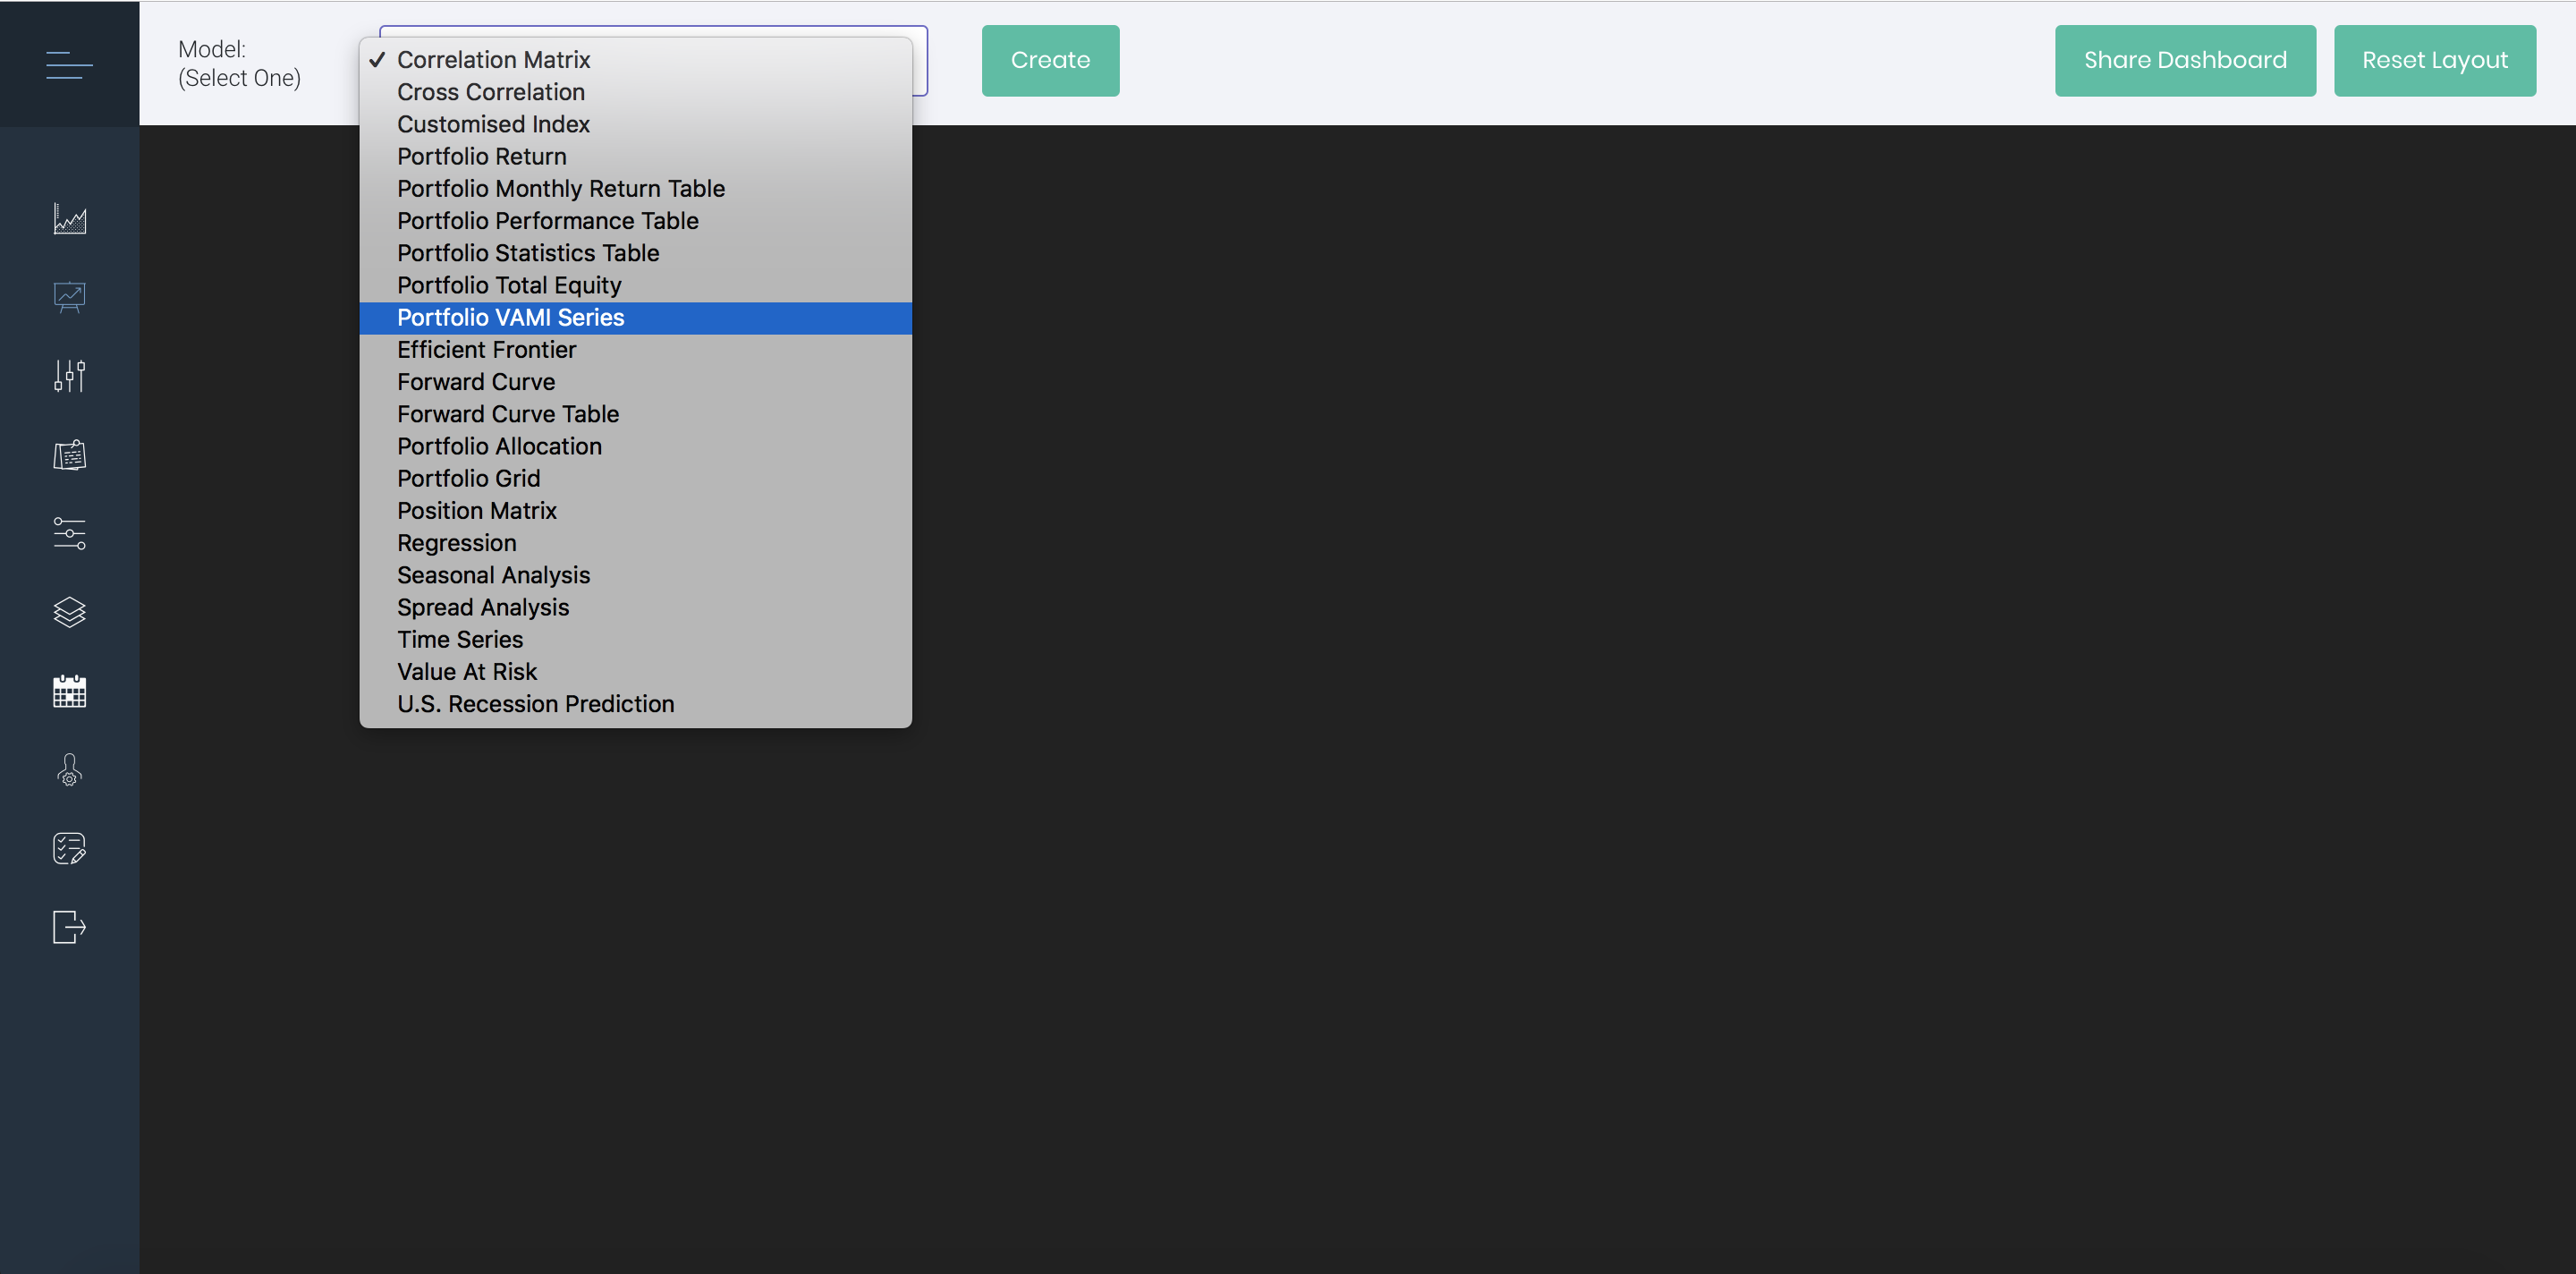
2. Select your desired quantitative model from the drop-down list and click 'Create', to open a window based on your selected model.
(Refer to 'Using your Dashboard in MAF Cloud' below to view the various models available to help you analyse your portfolios.)
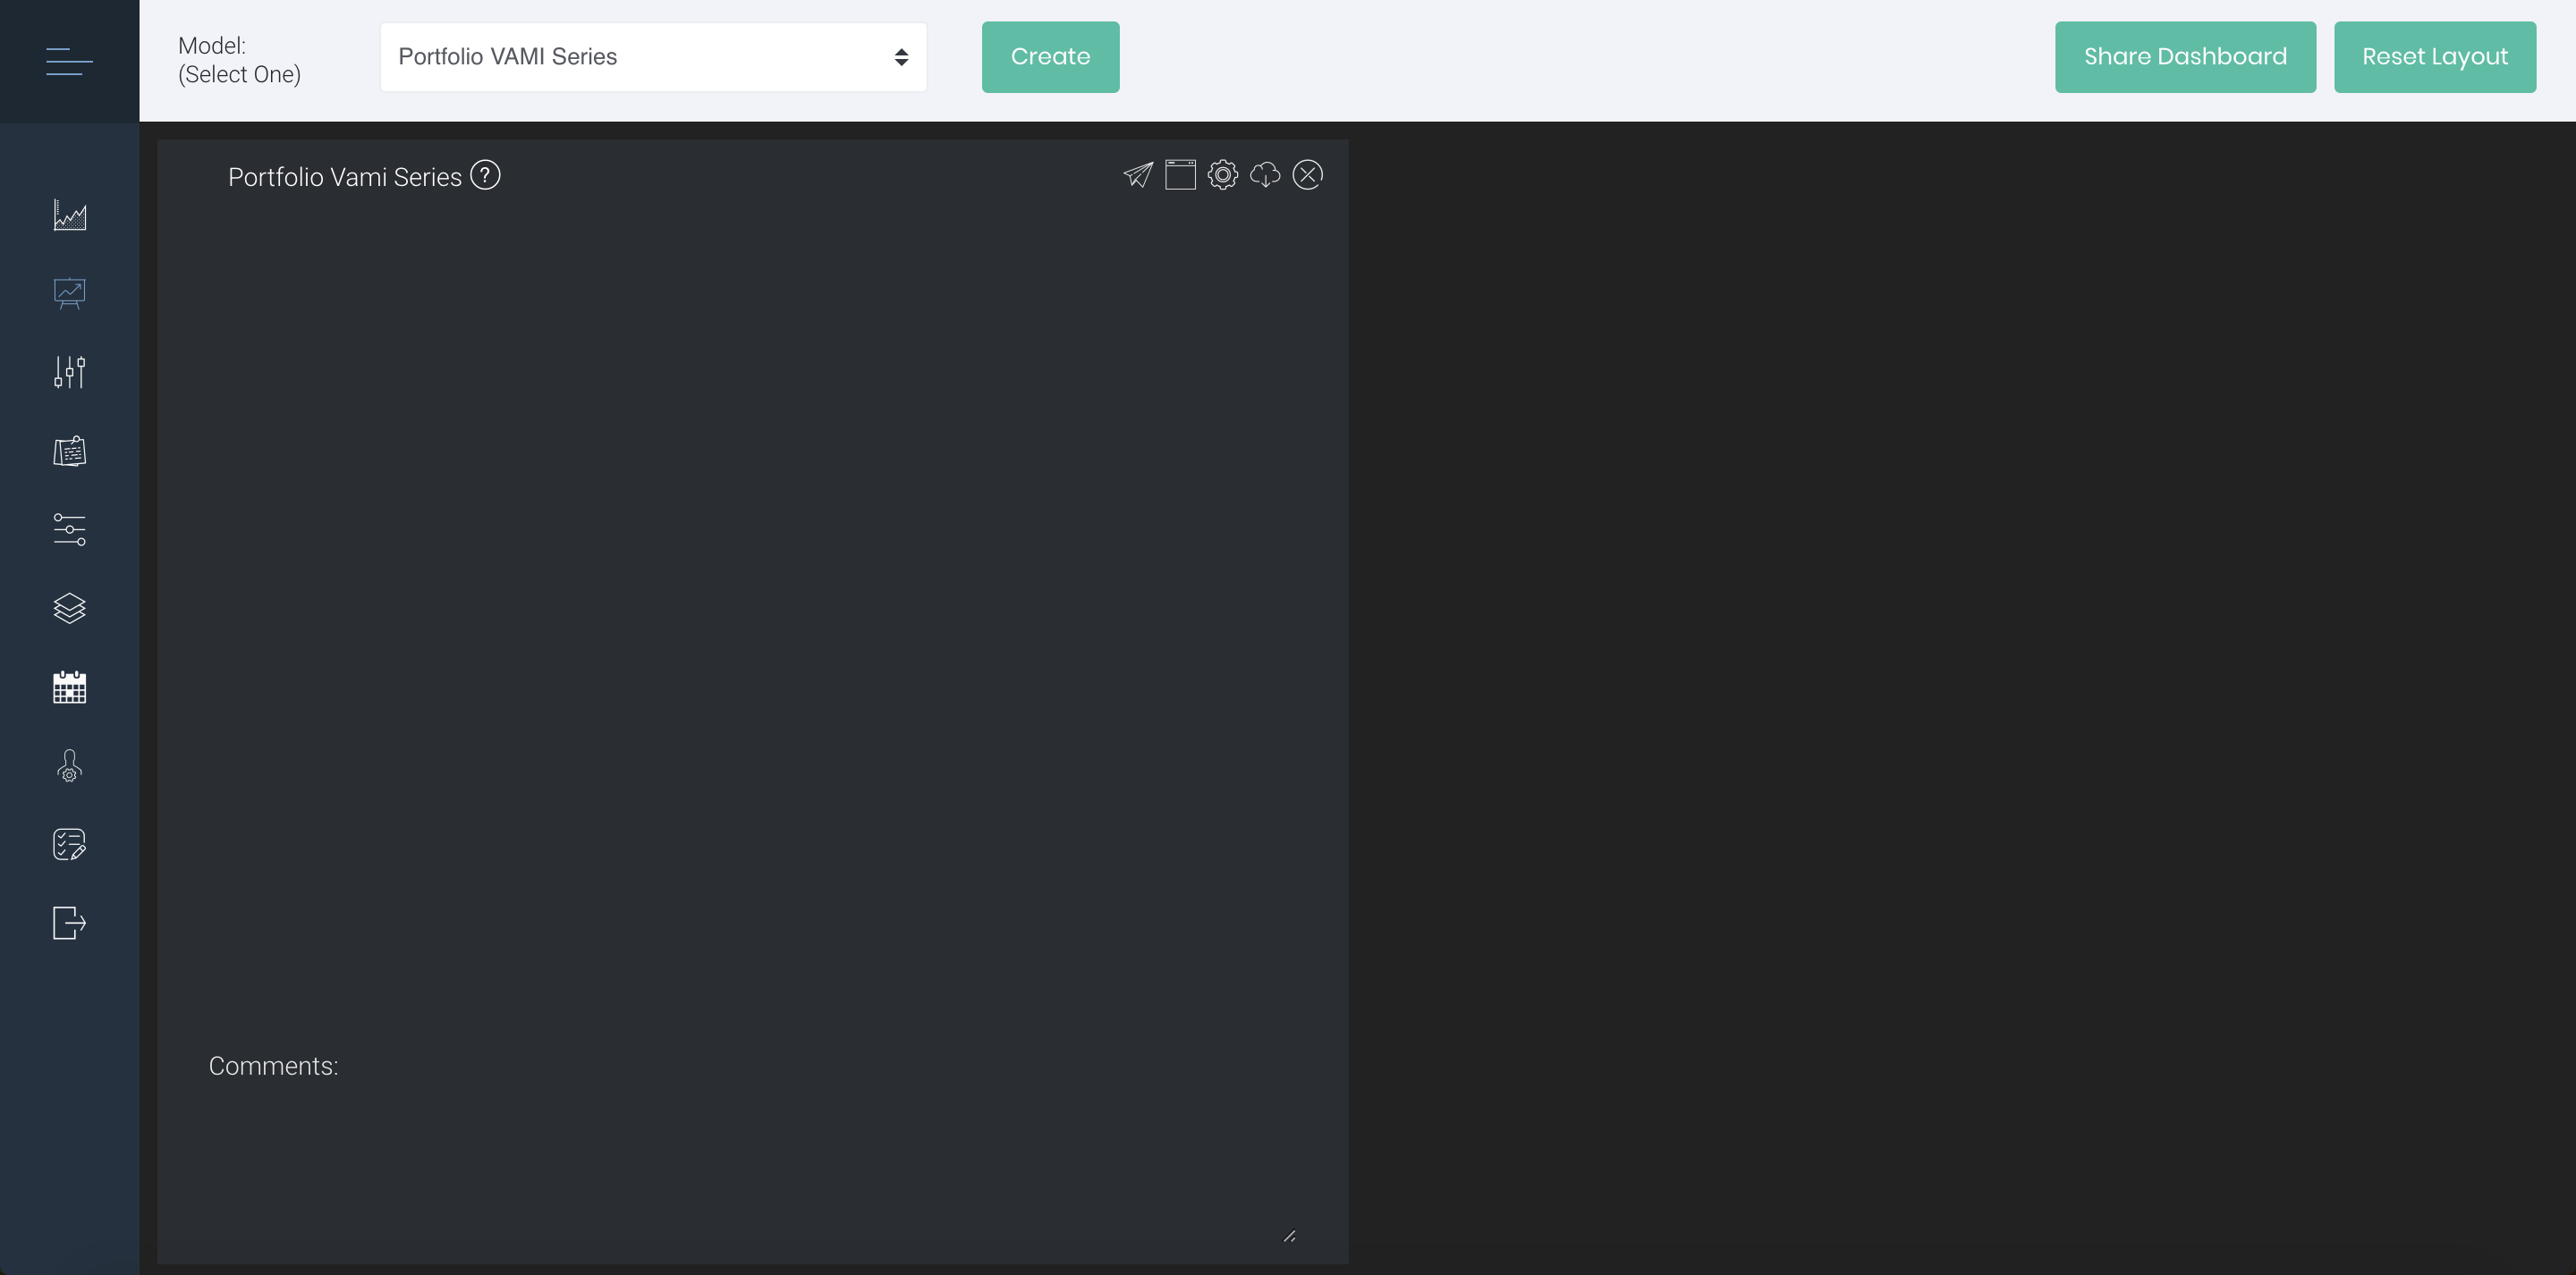
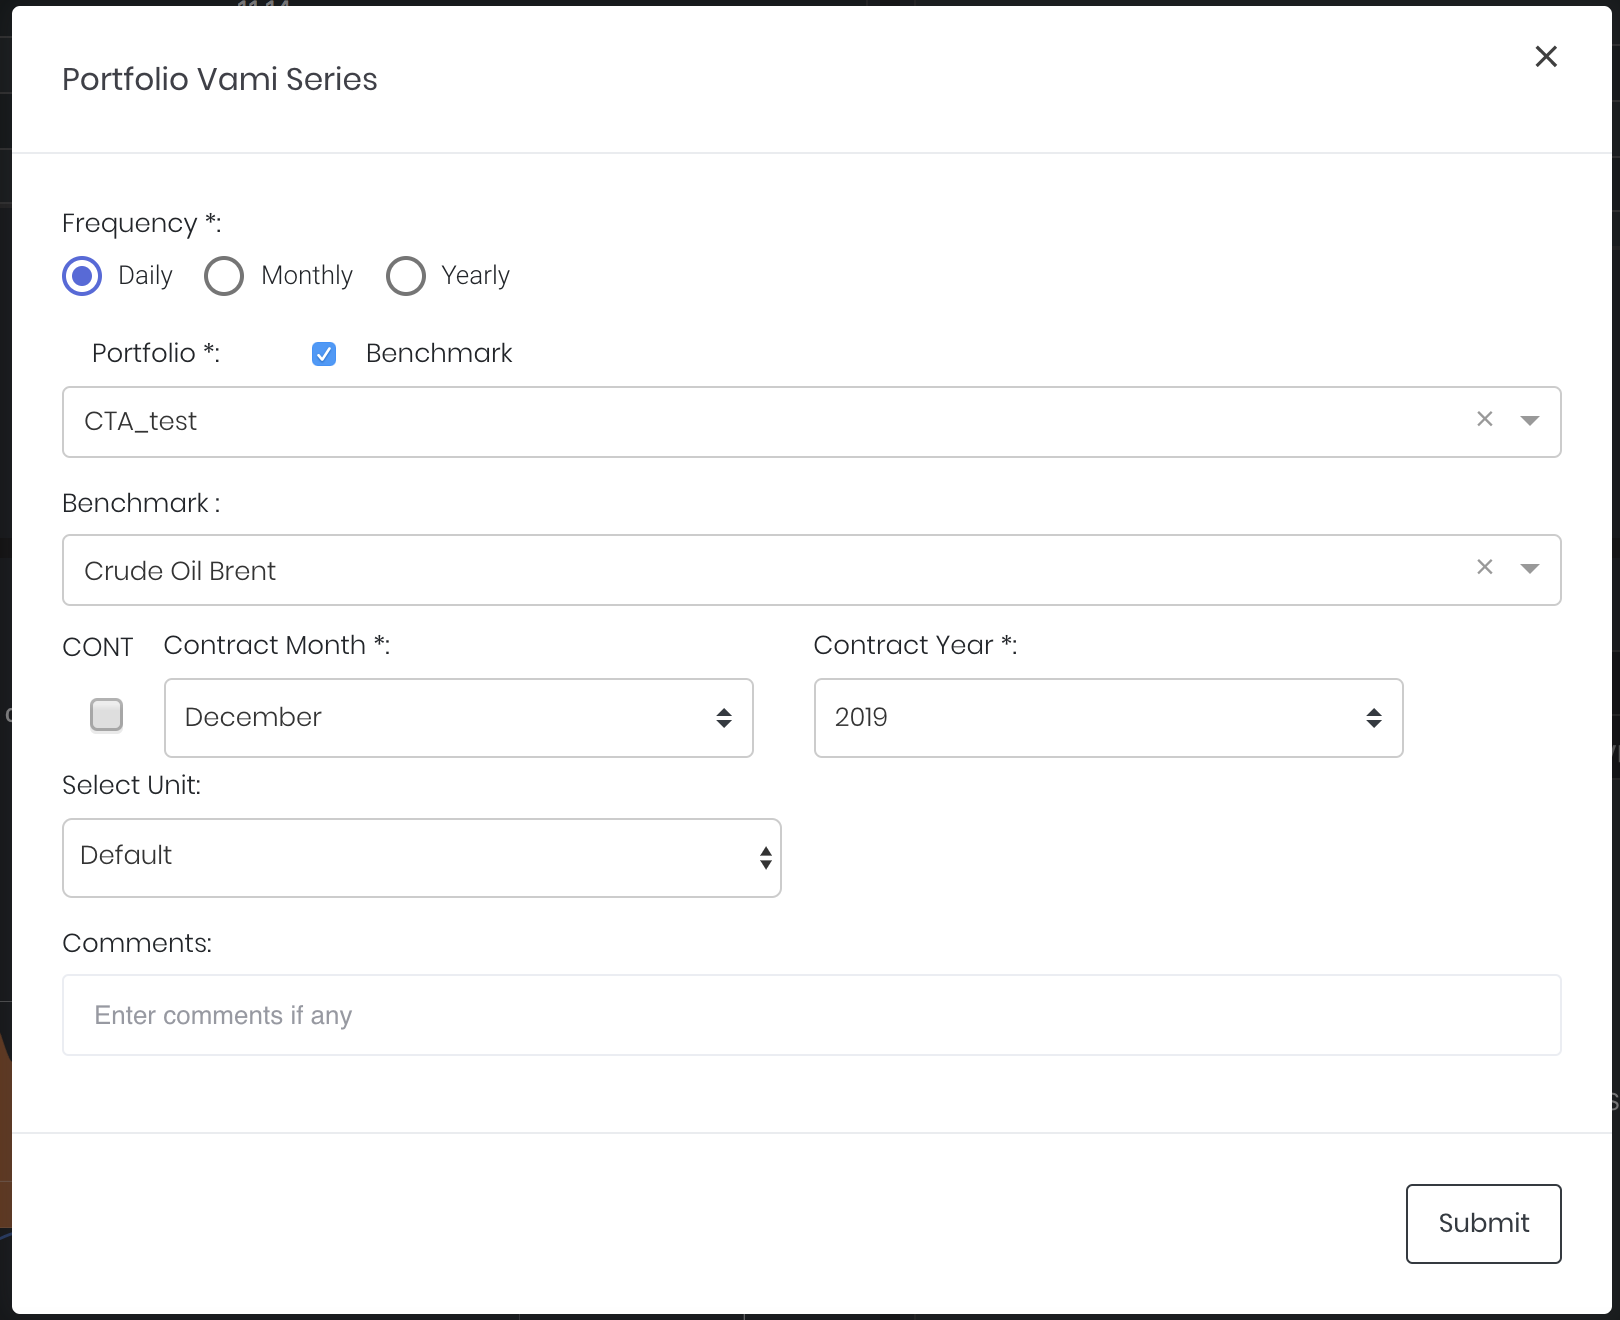
3. Input your portfolio details by clicking 'Settings' (represented by a 'gear' ![]() icon) in each window. Click 'Submit' when you're done and your desired quantitative model will be displayed!
icon) in each window. Click 'Submit' when you're done and your desired quantitative model will be displayed!
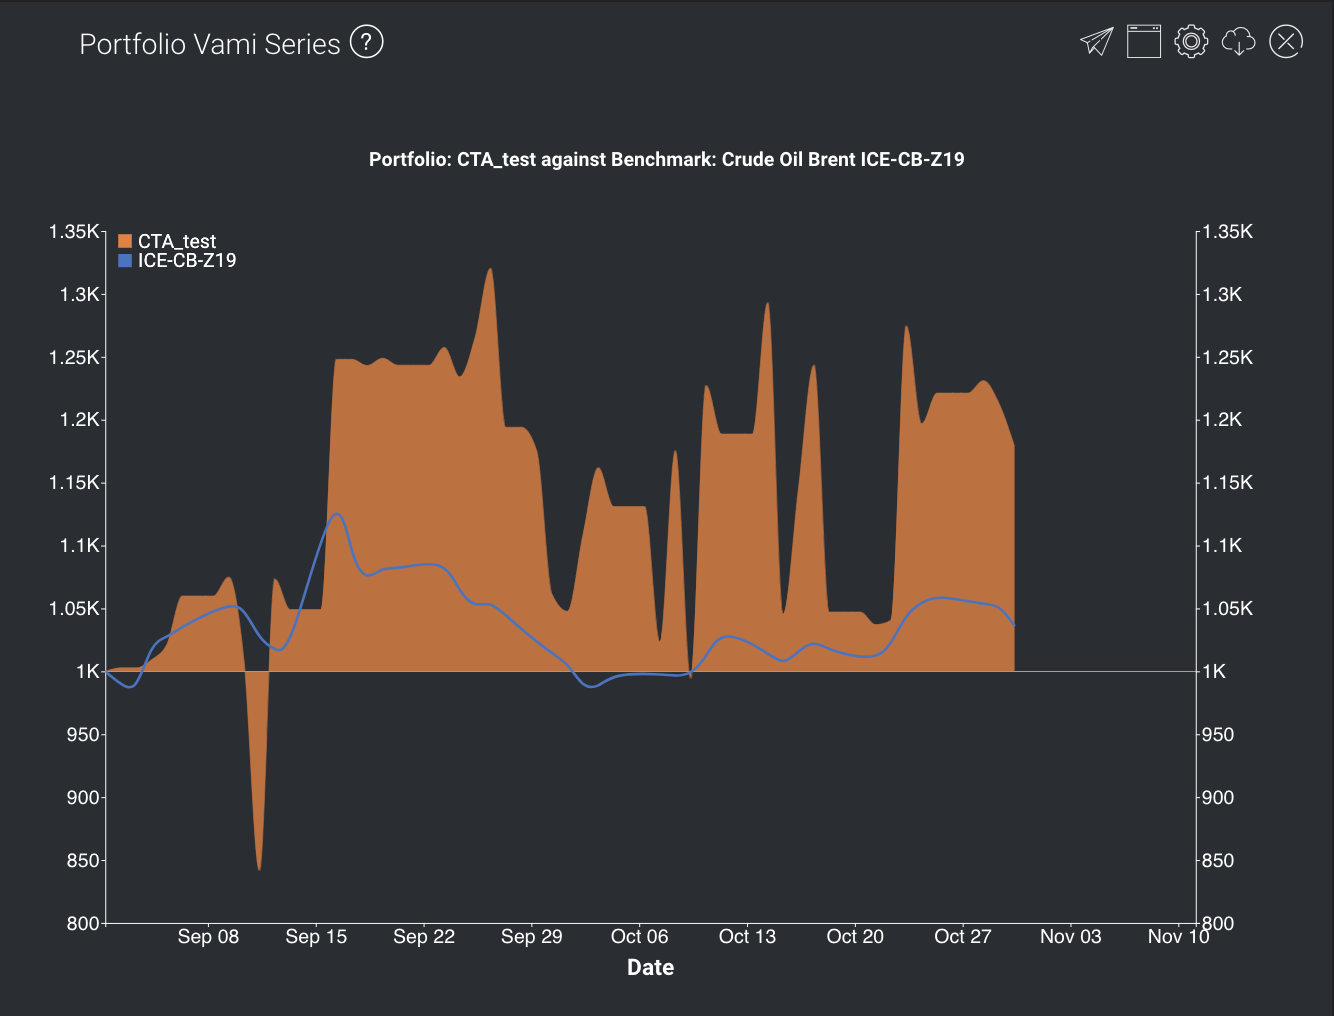
This is an example using the Portfolio VAMI Series Model.
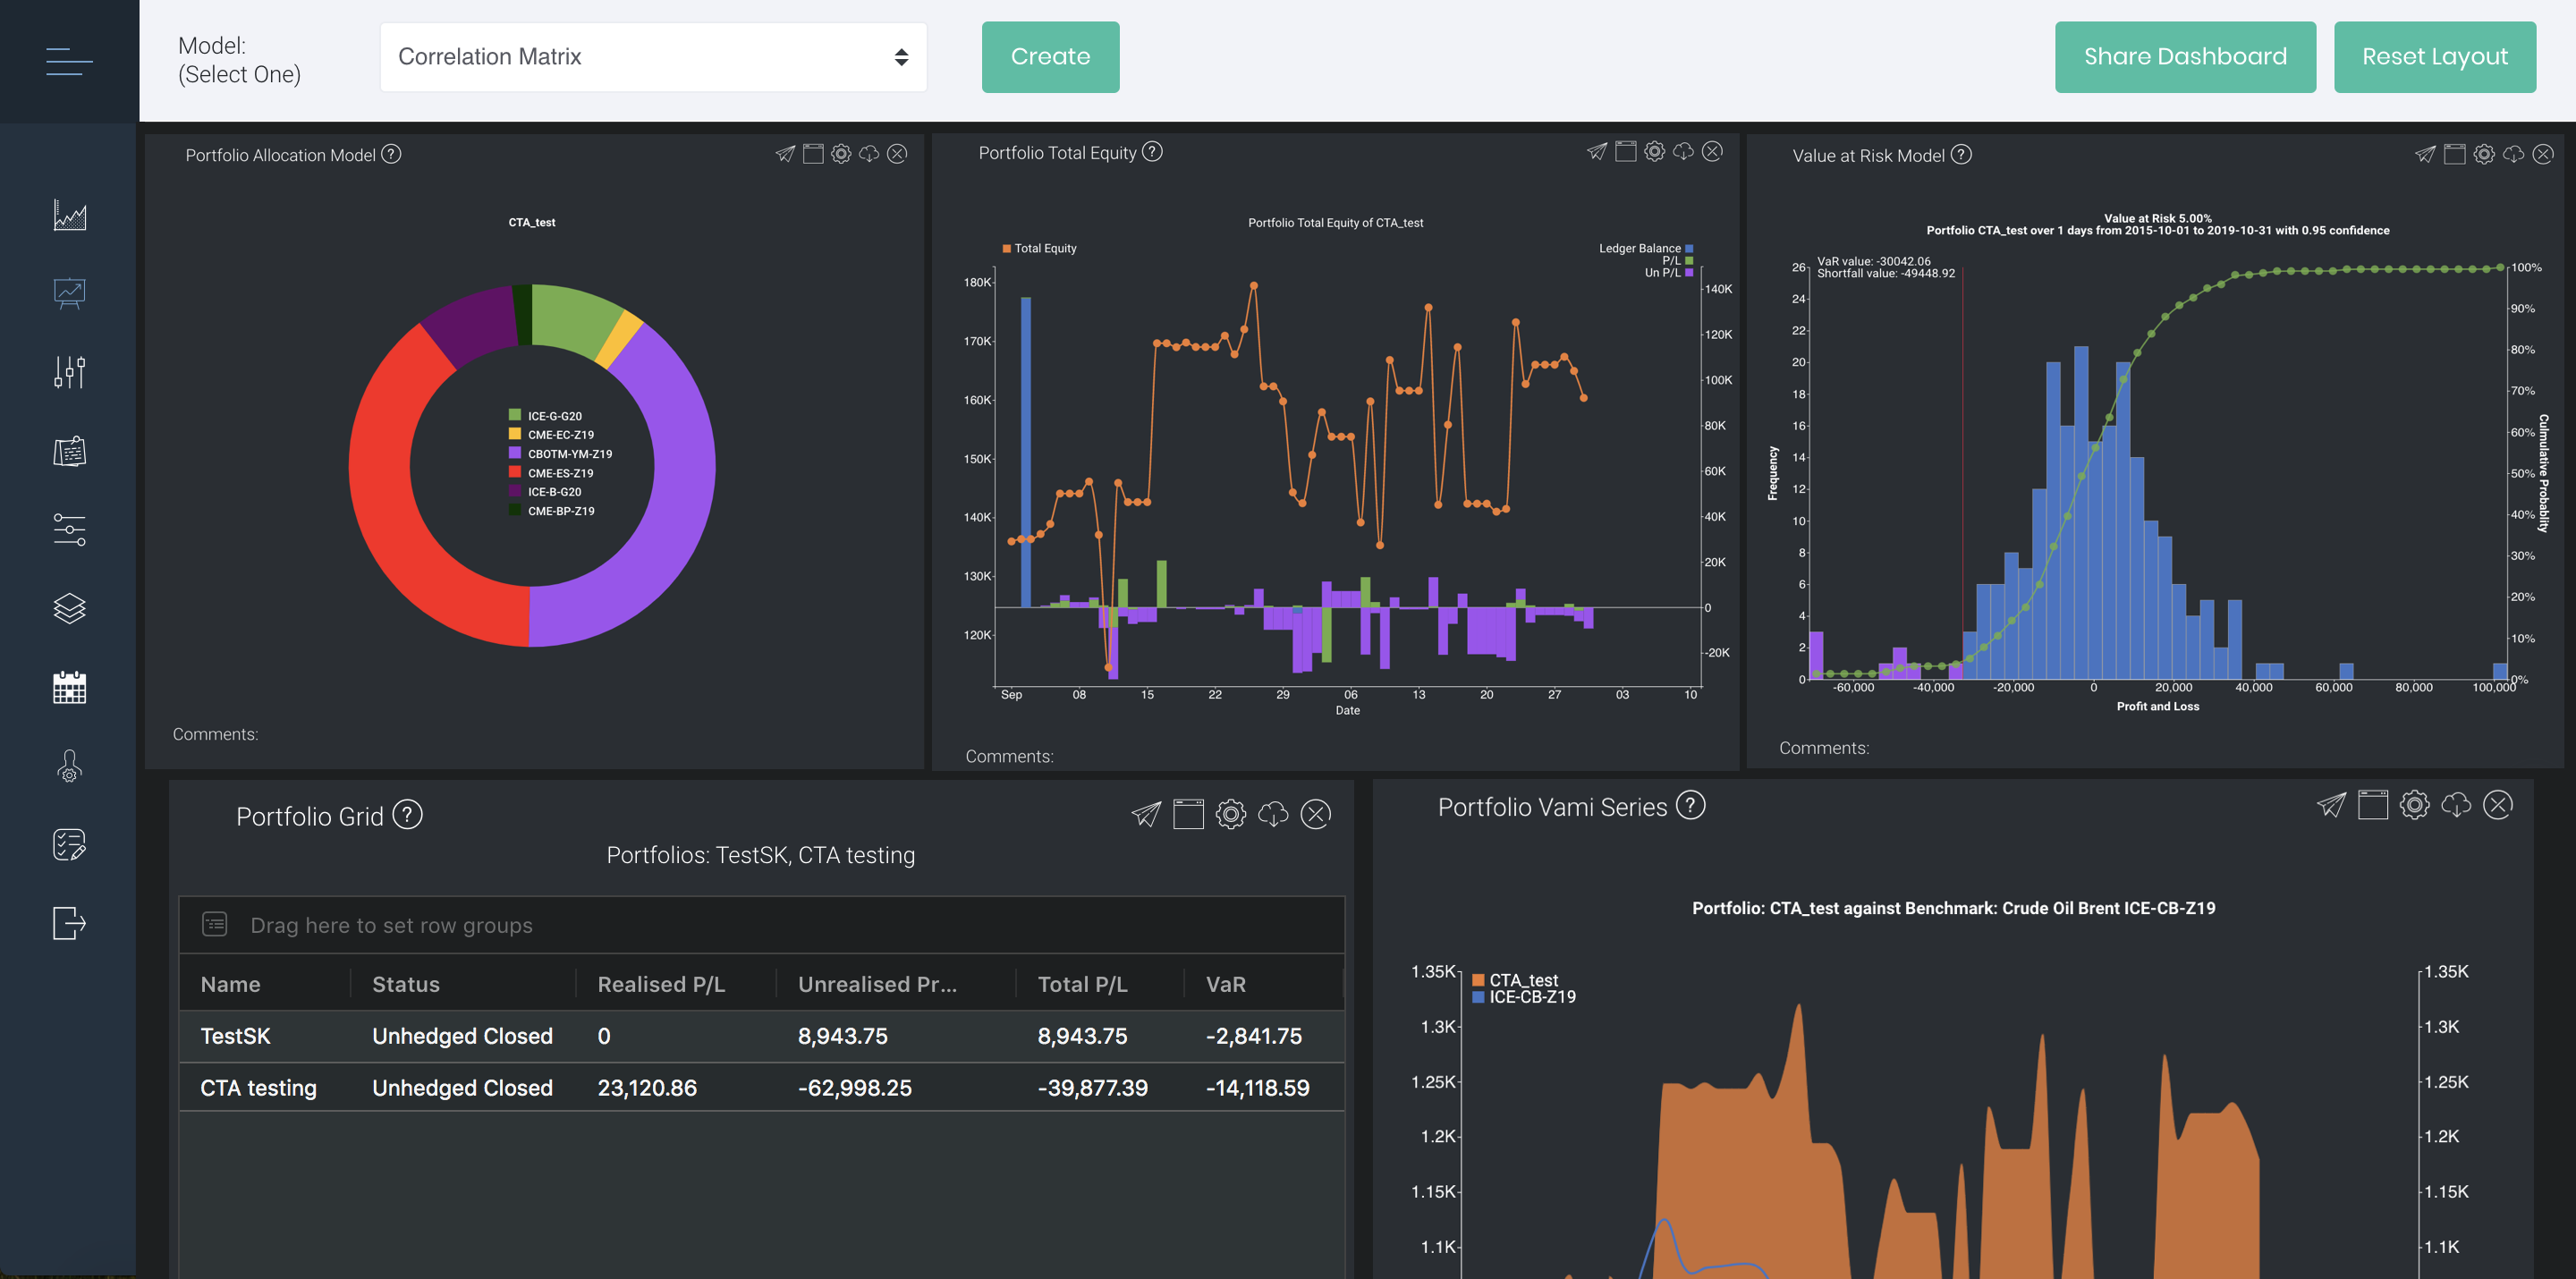
Here's an example of how your 'Dashboard' will look like with various quantitative models!
Using your Dashboard in MAF Cloud
MAF Cloud provides a variety of quantitative models (available in 'Dashboard') for you to analyse your portfolio(s) in different ways – you may use them to visualise and track your portfolio's performance, obtain key statistics, as well as present them effectively to clients or colleagues.
Read this article for a quick introduction of the portfolio management models available, and/or refer to their respective user guides below to learn more!
- Correlation Matrix Model
- Portfolio Allocation Model
- Portfolio Grid
- Portfolio Monthly Return Table
- Portfolio Performance Table
- Portfolio Return Model
- Portfolio Statistics Table
- Portfolio Total Equity Model
- Portfolio VAMI Series Model
- Position Matrix
- Value at Risk (VaR) Model
Additionally, after creating your desired model(s), you will be able to share your 'Dashboard' (or individual model within your 'Dashboard') with anyone via a temporary web link generated in MAF Cloud (expires in 8 hours). The recipient of your web link does not need to have a MAF Cloud account in order to access the models you shared!