In case you missed it – We have recently released 6 new ‘Trading Portfolio Management Models'! They will complement our existing quantitative models to enhance your portfolio analysis capabilities!
Fresh in MAF Cloud:
Portfolio Total Equity Model | |
 | “How big is my fund?” View changes to your portfolio’s total equity here! Please refer to Portfolio Total Equity Model (and General Ledger) for more information. |
Portfolio Return Model | |
 | Present the profits/losses of your portfolio at a glance! Please refer to Portfolio Return Model for more information. |
Portfolio VAMI Series Model | |
 | If an investor placed $1000 in your portfolio from the outset, how much would he/she have by now? Find out more with our Portfolio VAMI Series Model! Please refer to Portfolio VAMI Series Model for more information. |
Portfolio Performance Table | |
 | “How is my portfolio doing?” Find out your performance statistics and how you compare against market benchmarks here! Please refer to Portfolio Performance Table for more information. |
Portfolio Statistics Table | |
 | Slice and dice your portfolio data with our Portfolio Statistics Table – a favourite for number-crunchers! Please refer to Portfolio Statistics Table for more information. |
Portfolio Monthly Return Table | |
 | Watch your portfolio grow from month-to-month with our Portfolio Monthly Return Table! Please refer to Portfolio Monthly Return Table for more information. |
Tried-and-Trusted Classics:
Value at Risk Model | |
 | How much can your portfolio potentially lose (or make) in 1 day? Use our Value at Risk Model to estimate your risk exposure! Please refer to Value at Risk (VaR) Model for more information. |
Correlation Matrix Model | |
 | Will your portfolio’s assets move together or cancel each other’s risks during market swings? Find out with our Correlation Matrix! Please refer to Correlation Matrix Model for more information. |
Portfolio Allocation Model | |
 | Have your portfolio’s asset allocation at your fingertips! Please refer to Portfolio Allocation Model for more information. |
Portfolio Grid | |
 | Juggling multiple portfolios? Fret not. View your overall financial positions and risk exposure easily with our Portfolio Grid! Please refer to Portfolio Grid for more information. |
Position Matrix | |
 | Does your portfolio contain sophisticated strategies and spreads? You can now manage your positions easily with our Position Matrix! Please refer to Position Matrix for more information. |
If you have any queries, please drop us an email at support@mafint.com and we'll get in touch shortly.
Click here to try MAF Cloud (Beta) for free today!

We are excited to introduce to you two new features - ‘General Ledger’ and ‘Trading Portfolio Management Models'!
1. General Ledger
The 'General Ledger' allows users to record and monitor any related transactions in their portfolio. Any inflows and outflows related to their portfolio can be captured in the 'General Ledger', allowing users to add, edit, delete and view their transactions - all in one table.

Manage your portfolio transactions with ease with our ‘General Ledger’!
The ‘General Ledger’ feature is available under the ‘Portfolio’ section.
Try it out today and allow MAF Cloud to organise large volumes of portfolio proceeds for you!
For more information, please refer to General Ledger for a detailed user guide.
2. Trading Portfolio Management Models
6 new ‘Trading Portfolio Management Models' are now available in the ‘Dashboard’:
These models would provide you with a variety of tools to visualise, obtain data on, and present the performance of your portfolio.

View your portfolio’s equity and returns charts in the ‘Dashboard’, and find out how you stack up against market benchmarks!

Our models further provide a summary statistics of your portfolio – at a glance!
Discover what these portfolio functionalities can do for you in MAF Cloud today!
For more information, please refer to Trading Portfolio Management Models for a detailed user guide.
If you have any queries, please drop us an email at support@mafint.com and we'll get in touch shortly.
Click here to try MAF Cloud (Beta) for free today!

Amidst a slowing global economy and rising international tensions, investors increasingly worry that the U.S. economy’s expansion in the past 10 years might finally be coming to an end. Especially after the Fed’s rate cut in July, searches for “US recession” on Google have more than quadrupled. A slew of macroeconomic indicators further display signals of a probable slowdown. How close are we to another recession?
Our newly-released U.S. Recession Prediction Model in MAF Cloud uses the U.S. yield curve spread as a predictive tool for impending recessions. Yield curve inversions are often seen as warning signs of a looming downturn, having preceded every major recession in the past 30 years (in 1989, 2001 and 2007). The model utilises FRED data on the 10-Year and 3-Month U.S. Treasury Yield Spread, together with historical recession data from NBER, to estimate the likelihood of a recession in the U.S. with a 12-month horizon using a probit model.
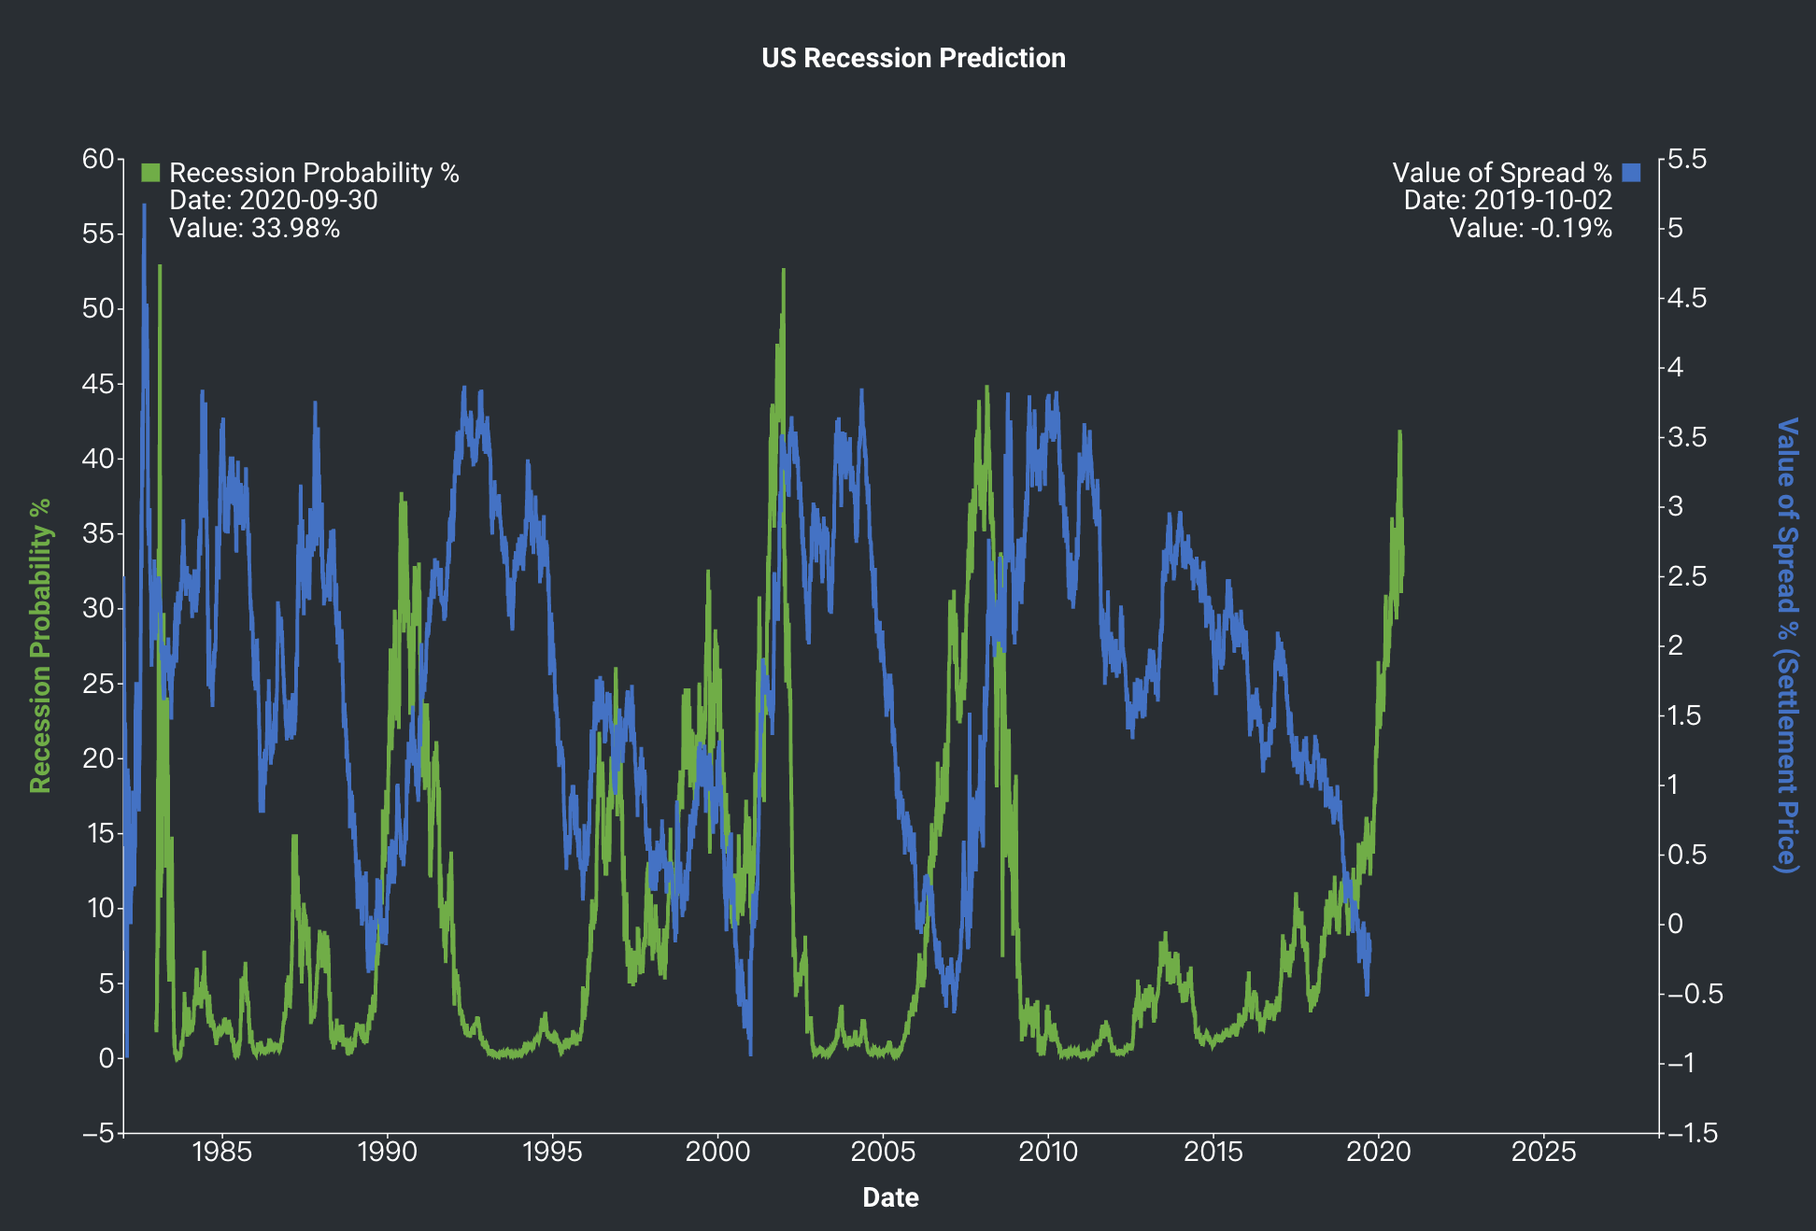
In the chart above, the blue time-series shows the yield curve spread, while the green time-series shows the predicted recession probability. We can see that the U.S. yield curve has flattened steadily in the past 10 years, before finally inverting in early 2019. Meanwhile, the estimated likelihood of a recession, having remained stable for most of the decade, has lately spiked to 33.98% for the year 2020 (estimated as of 2019-9-30).
With the peaks of the model’s predictions having coincided almost exactly with past realised recessions – the 1990-1991 Credit Crunch, 2001 Dot-com Crash, and 2008 Financial Crisis – could this be the precursor of yet another downturn to come?
Recent developments in the U.S. economy have indeed compounded on investors’ anxieties. As exports plummeted with deteriorating trade relations between China and the U.S., so did business confidence in affected industries: the Purchasing Managers’ Index (PMI) has slipped to its lowest point in a decade. Furthermore, the U.S. inflation rate in 2019 has consistently fallen short of the Fed’s 2% target, while growth forecasts hovered around 1%-1.5%.
How sure can we be of an imminent recession? Is this yet another repetition of the pattern? While the U.S. yield curve spread has proven to be a generally reliable leading indicator of U.S. recessions, it has a history of over-predicting recessions which did not materialise. Moreover, it does not convey any information about the length or severity of the predicted recessions.
Another consideration is that both the contemporary economic slowdown and flattening of the U.S. yield curve seem to be driven by policy decisions rather than market fundamentals – with the former tending to be the more unpredictable of the two. Could the Fed be pressured to prop up the economy with yet another round of monetary easing (hence further driving down long-term yields)? Or might President Trump, faced with ceaseless criticism from industries adversely affected by the trade war, as well as electoral pressure from the upcoming elections, choose to adjust his stance in trade negotiations – pursuing instead a course of prioritising domestic growth, while balancing the interests of exporters and importers alike?
Putting these into perspective:
Is the US economy due for another downward cycle, or is the present yield curve inversion just a false alarm?
How to generate this graph on MAF Cloud:
In the U.S. Recession Prediction Model, set ‘Start Date’ as “1979-09-01” and ‘End Date’ as the current date, to generate and view historical data on the yield curve spread (FRED-T10Y3M), together with the associated recession probability estimated by the model for the following 12 months.
Click here to try MAF Cloud (Beta) for free today!

1. Featured Charts
The ‘Featured Charts’ page consists of a myriad of industry-relevant charts generated using MAF Cloud’s data and quantitative models. These charts are created by industry experts, giving you the opportunity to discover the latest market trends and insights, investment opportunities and trading ideas!

Discover what’s hot in the market from our ‘Featured Charts’!
If you find any chart that interests you, you can add it into your ‘Dashboard’, and customise the settings according to your needs.
Gain valuable insights from the industry experts and try MAF Cloud today!
For more information, please refer to Featured Charts for a detailed user guide.
2. U.S. Recession Prediction Model
The 'U.S. Recession Prediction Model’ uses data on the U.S. yield curve spread to predict the likelihood of an imminent recession. The model draws the data of past probabilities based on the U.S. yield curve spread with each yield curve fitted to a probability of predicting a recession in the next 12 months.

As of 2019-09-30, the yield curve spread (FRED-T10Y3M) is negative at -0.20%, and the predicted recession likelihood is 34.21%. Should investors be hedging their portfolios against possible recession risk?
Keep up-to-date with the U.S. Recession predictions in MAF Cloud today!
For more information, please refer to U.S. Recession Prediction Model for a detailed user guide.
If you have any queries, please drop us an email at support@mafint.com and we'll get in touch shortly.
Click here to try MAF Cloud (Beta) for free today!
