Featured Charts
- MAF Intern (Unlicensed)
- IT Support
- Christabel Chiang (Unlicensed)
Return to Overview
Sign up for a MAF Cloud account here & gain access to this feature for free indefinitely (and 30 days' free trial of the paid features)!
1. Upon signing up, you will receive 2 emails:
a. Account Verification Email. Please follow the instructions in the email to verify your email address to activate your account.
b. Welcome Email. This provides some guidance on navigating and using MAF Cloud, to help you get started!
2. Sign into your account and click 'Featured Charts' from the navigation sidebar on the left and you're good to go!
About
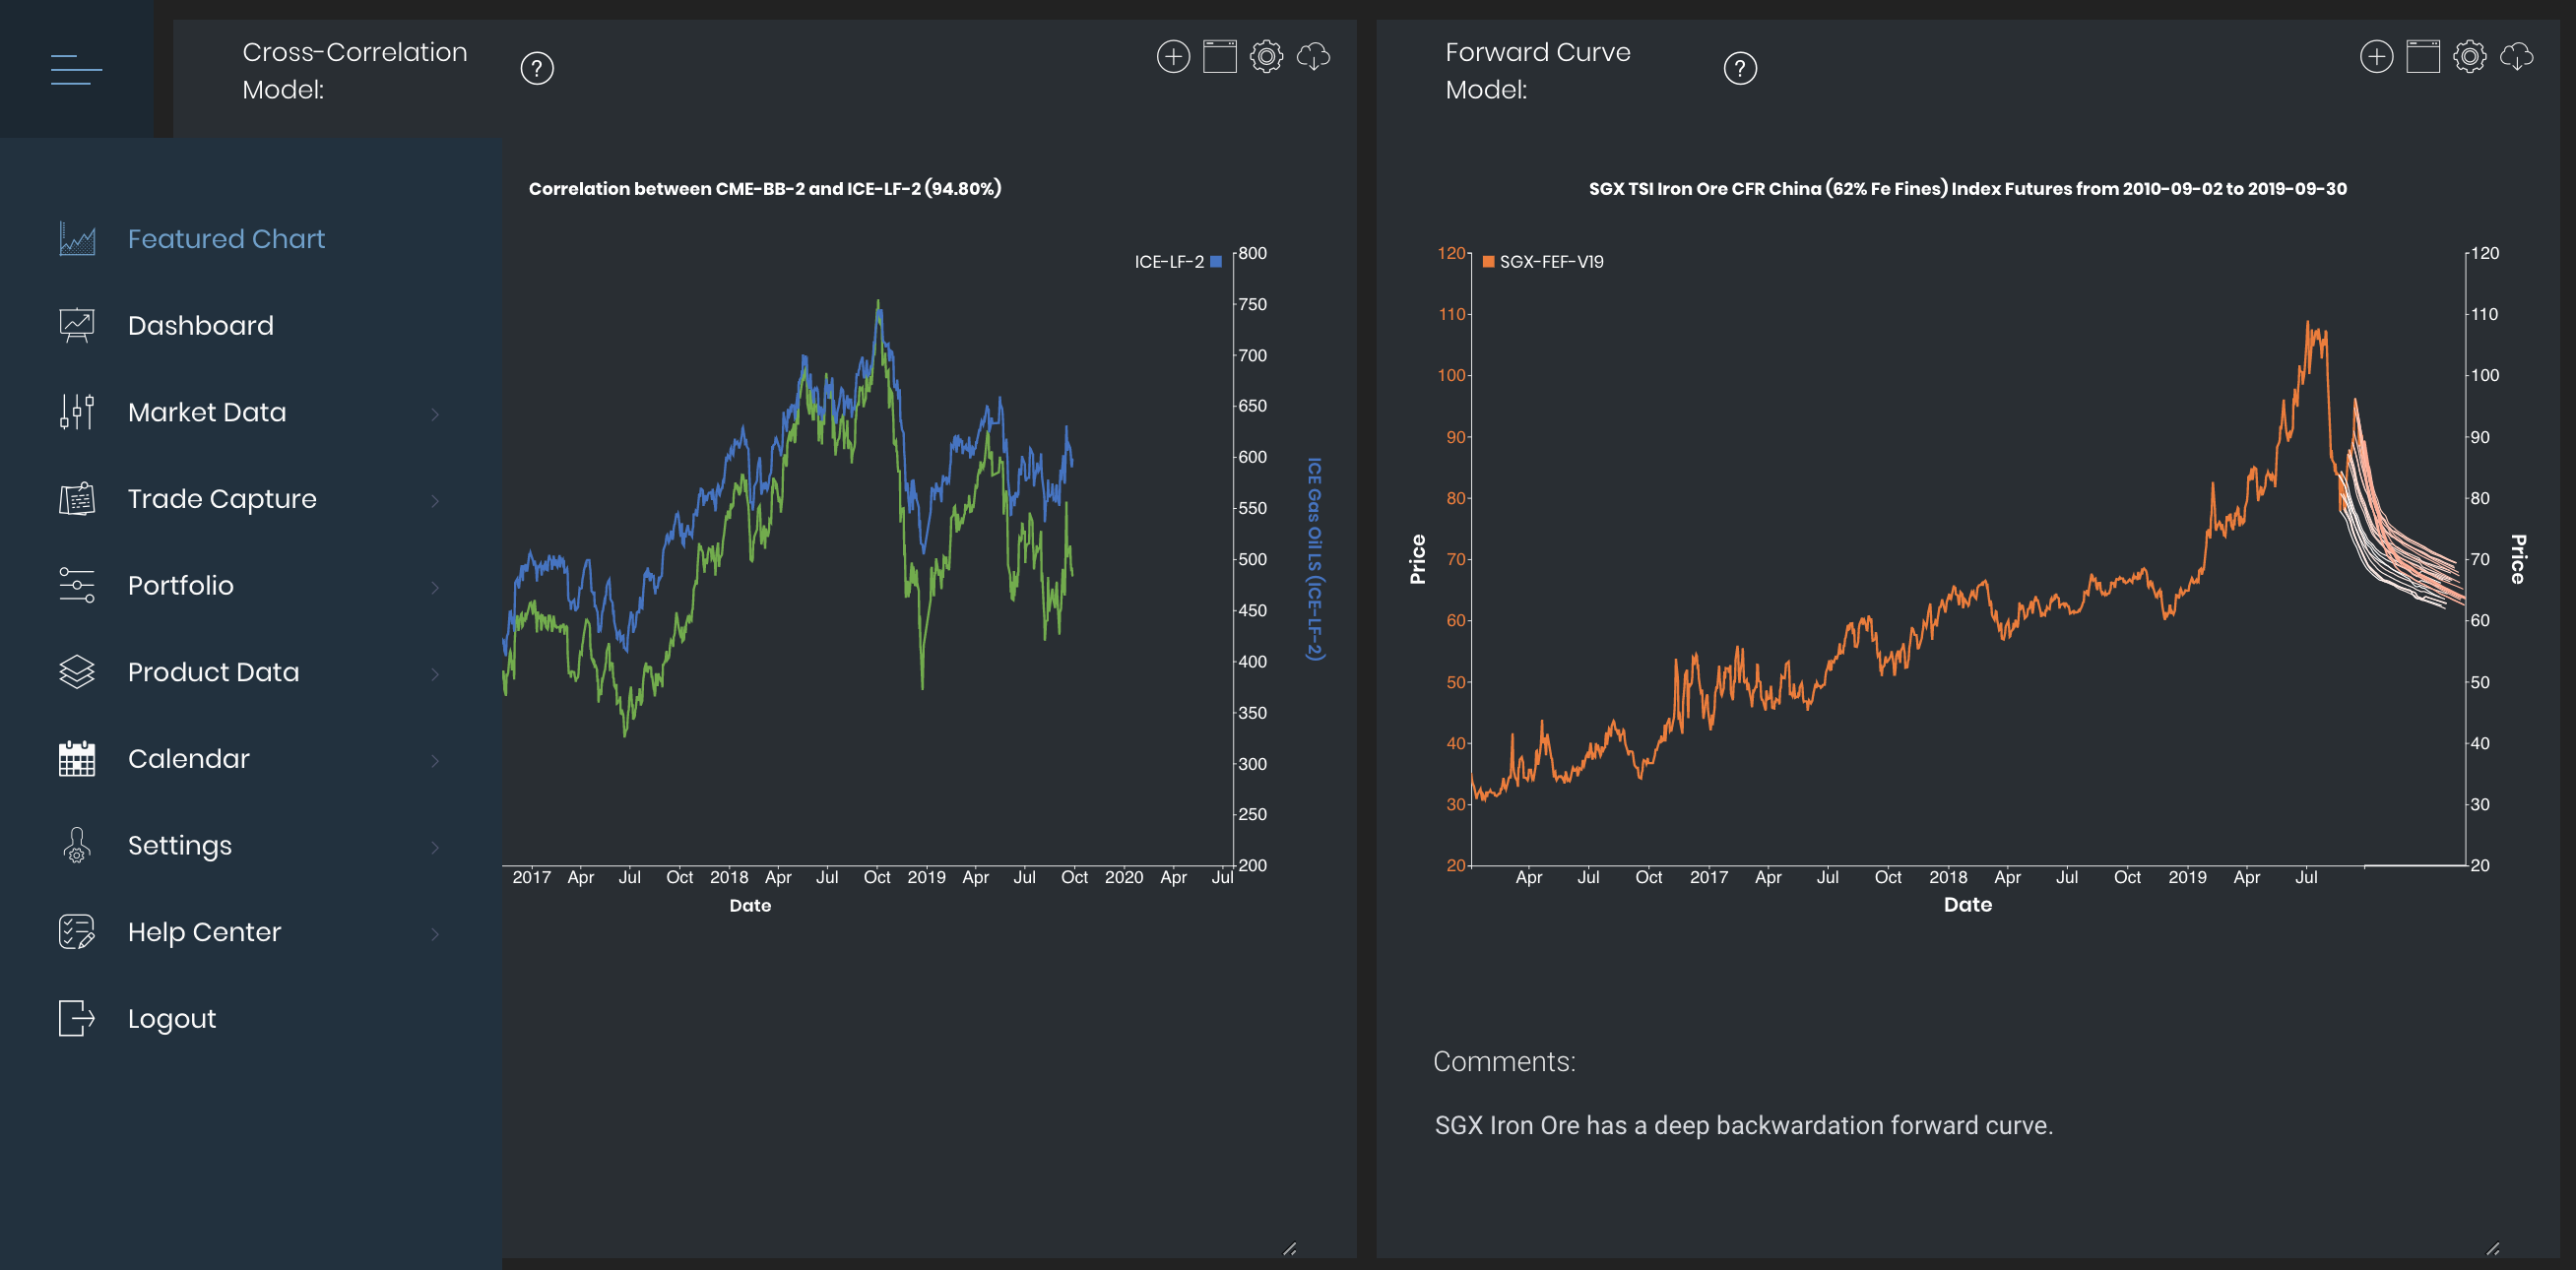
The 'Featured Charts' page is a gallery of charts created by industry experts using quantitative models from MAF Cloud, allowing users to gain timely updates on market trends and insights, and to discover new investment opportunities and trading ideas. Users can also familiarise themselves with the various models available in MAF Cloud with the examples featured here.
The 'Featured Charts' page will be the first page a user sees whenever he/she signs into MAF Cloud. Alternatively, users can access the 'Featured Charts' page by clicking on the first button (represented by a 'chart' icon) from the navigation bar on the left.
Users may add any model(s) (featured in this page) that they find interesting or relevant into their own 'Dashboard'. Once the model(s) is/are added into their 'Dashboard', they can edit the input settings to customise the model(s) to suit their needs. Please refer to below for more information.
*Do note that users will not be able to edit or remove any chart(s) from the 'Featured Charts' page. Only authorised users will have permission to add chart(s) into or remove chart(s) from the 'Featured Charts' page through their 'Dashboard'.
This page will be constantly updated with new charts, please feel free to use them!
Adding featured chart(s) into your 'Dashboard'
You can choose to create charts using the available quantitative models in 'Dashboard' page, or add some of the charts directly from the 'Featured Charts' page into your 'Dashboard'.
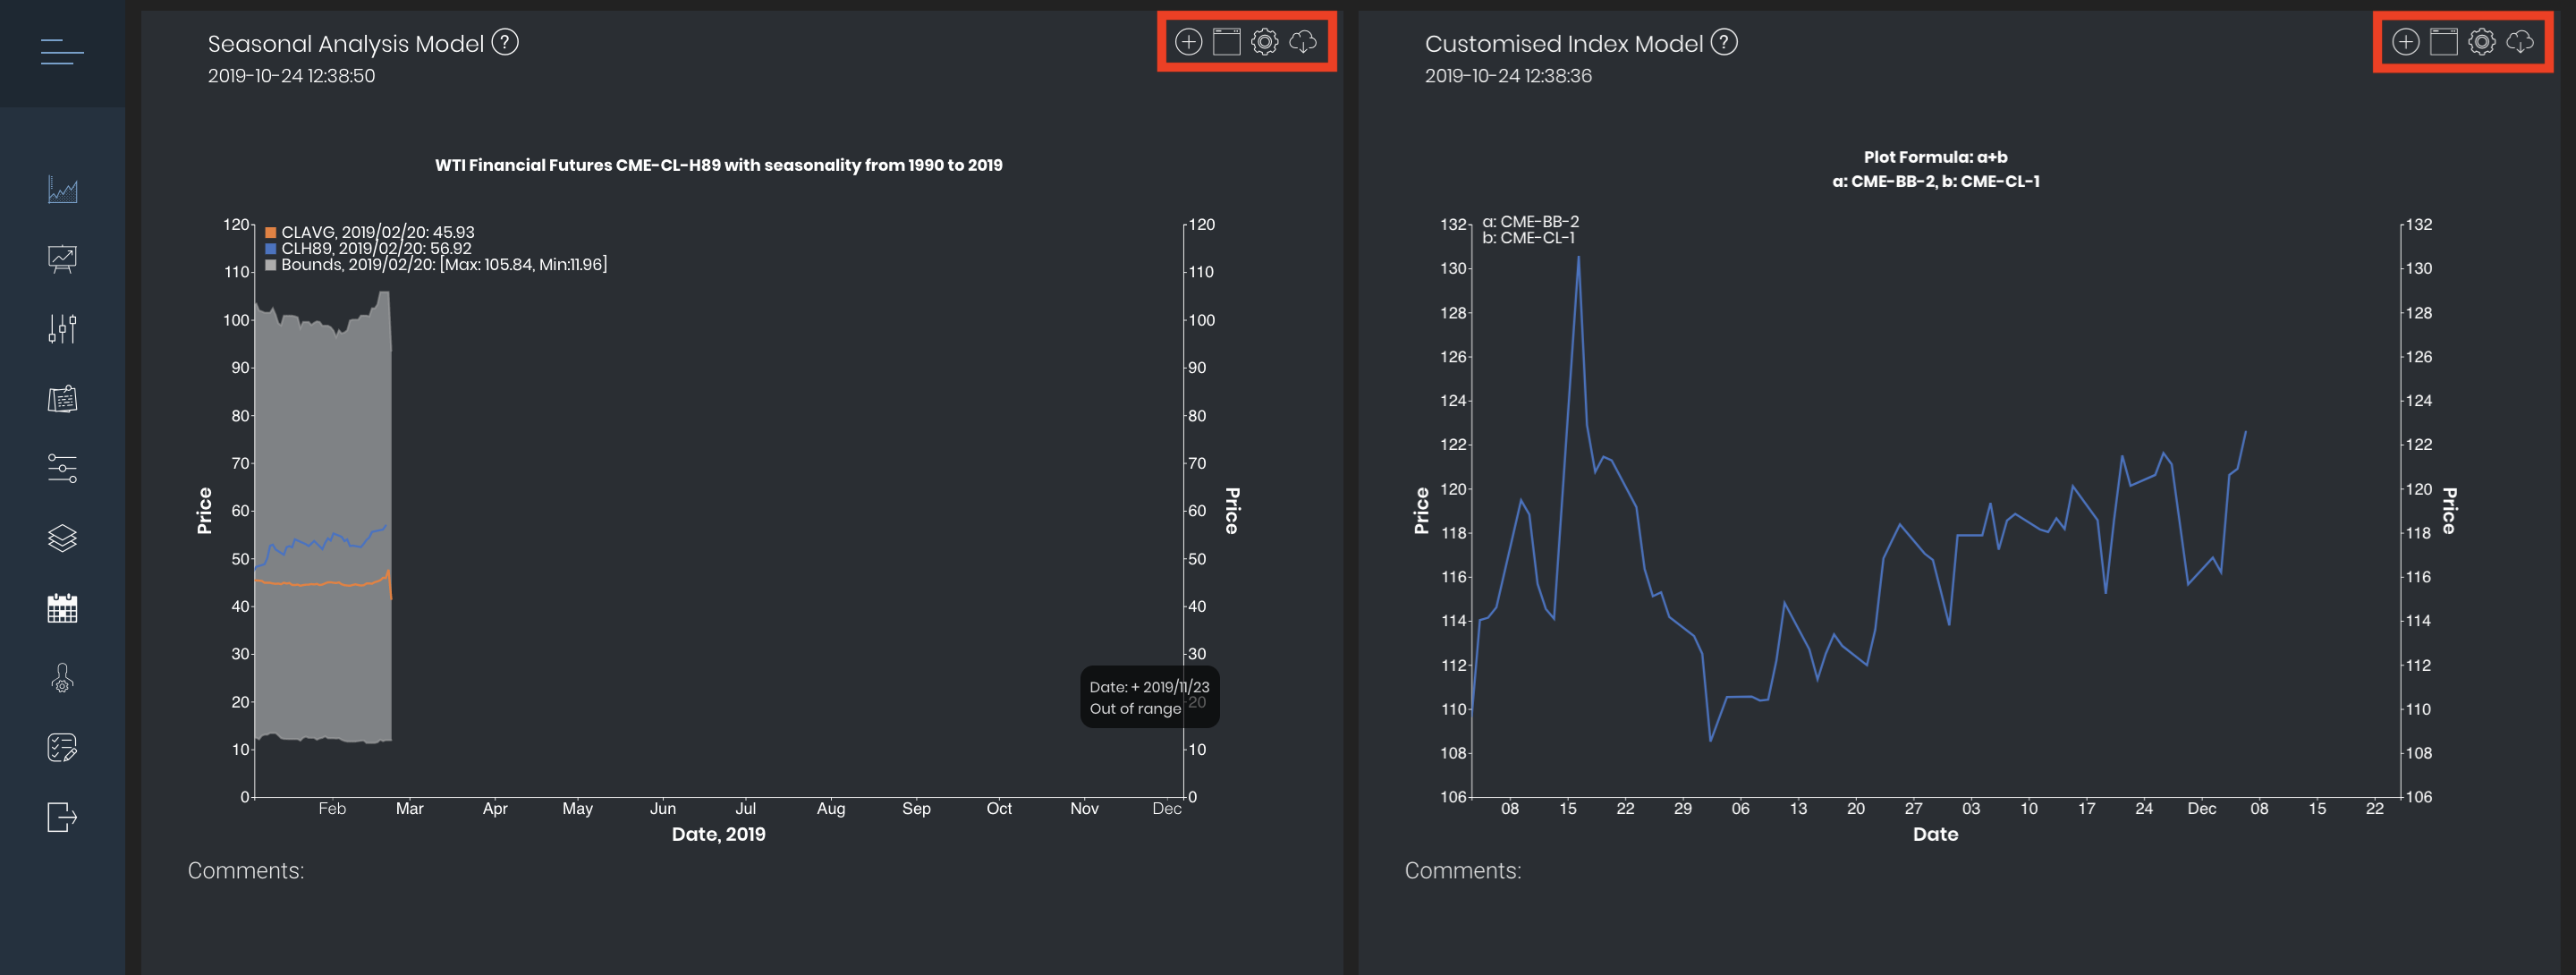
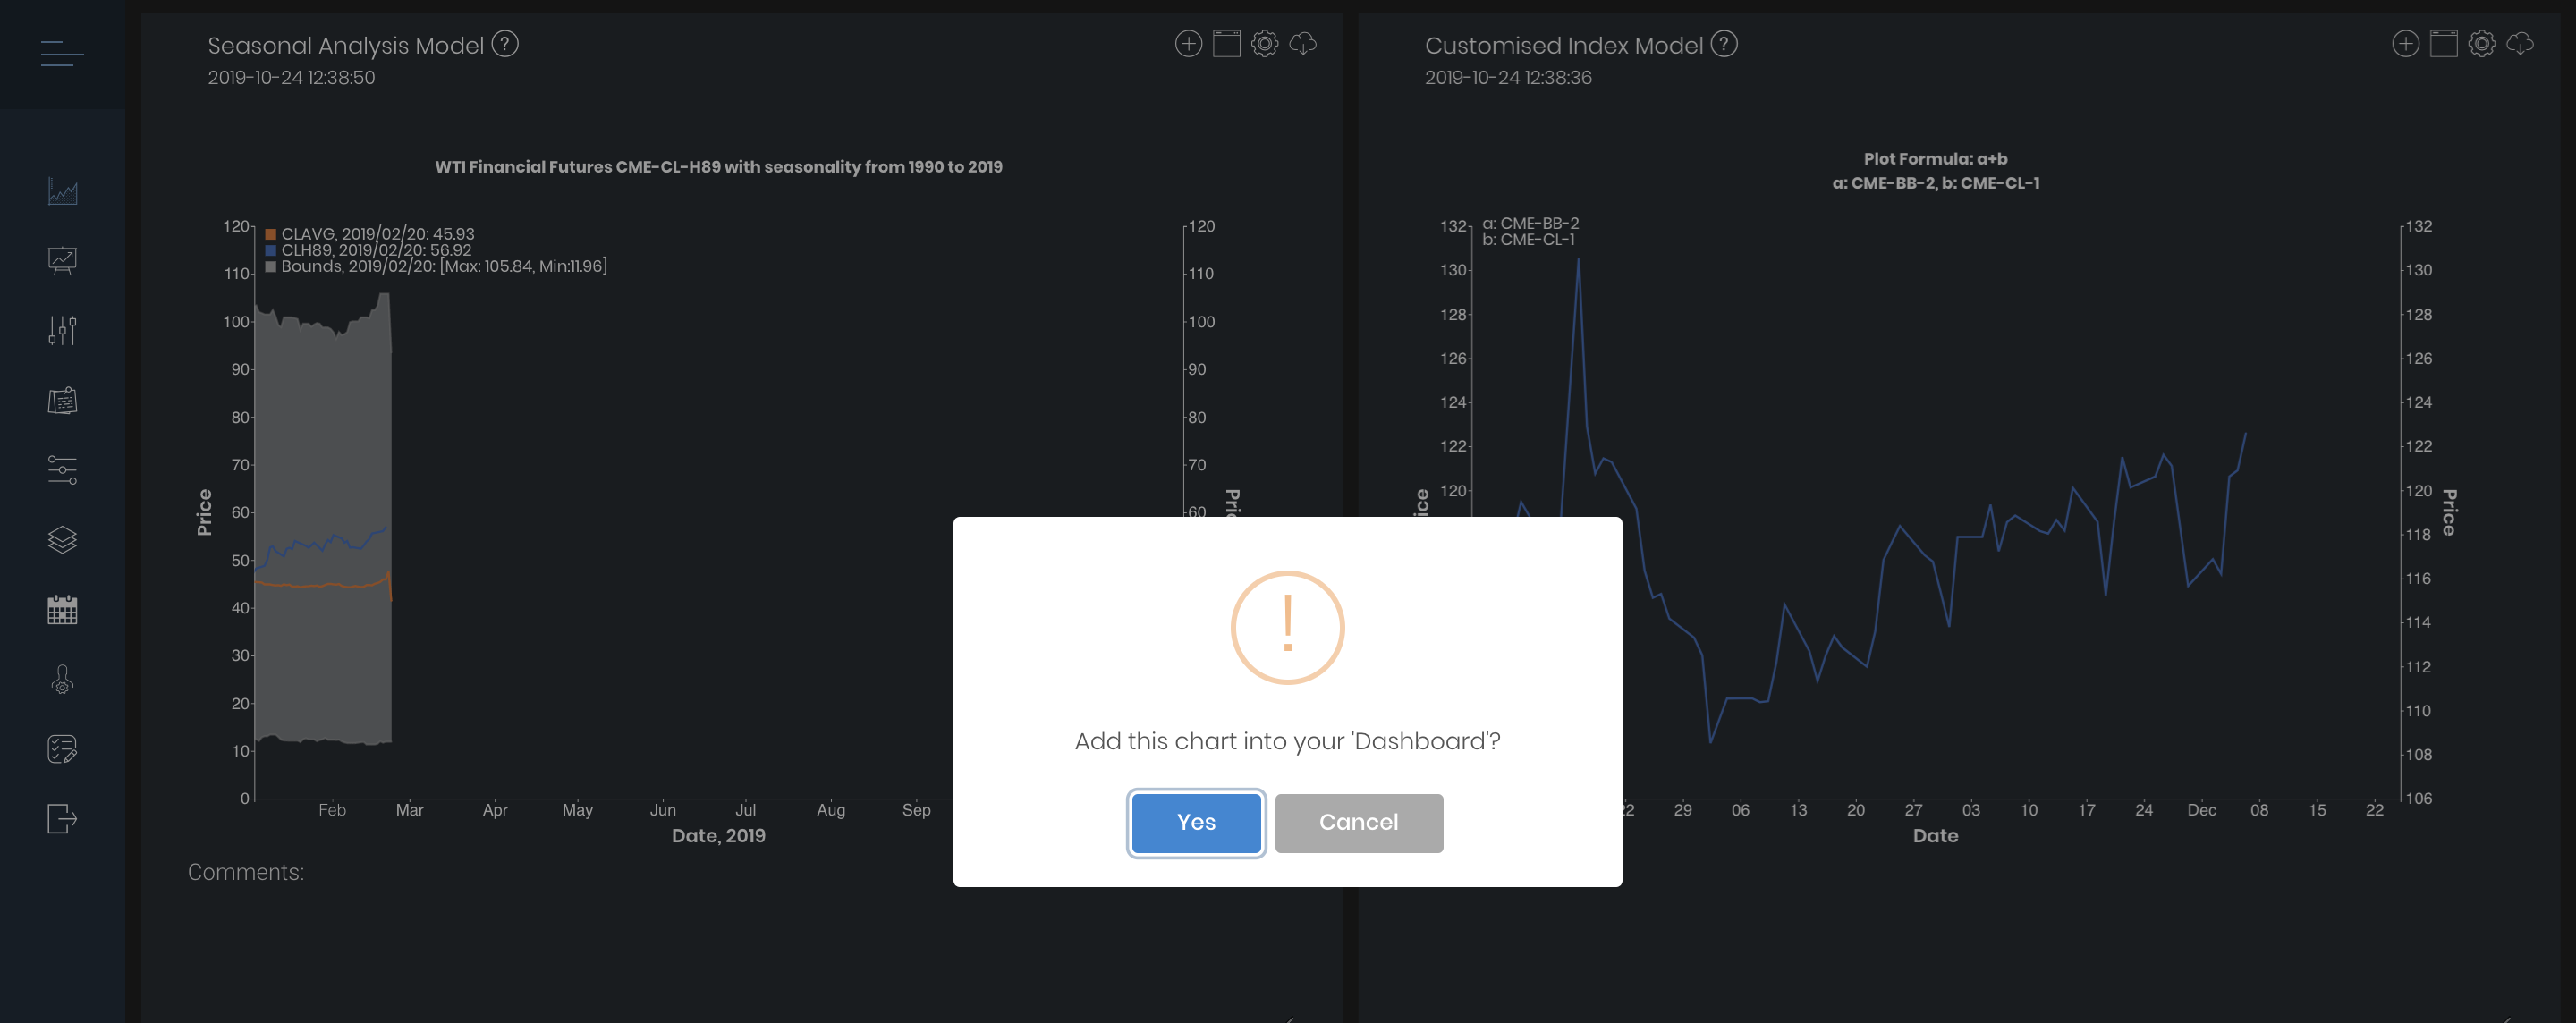
1. Proceed to the 'Featured Charts' page and click on the 'add' icon ![]() on the top right-hand corner of the chart to add the chart into your 'Dashboard'. Additionally, you may view the chart's input settings by clicking on the 'gear' icon
on the top right-hand corner of the chart to add the chart into your 'Dashboard'. Additionally, you may view the chart's input settings by clicking on the 'gear' icon ![]() .
.
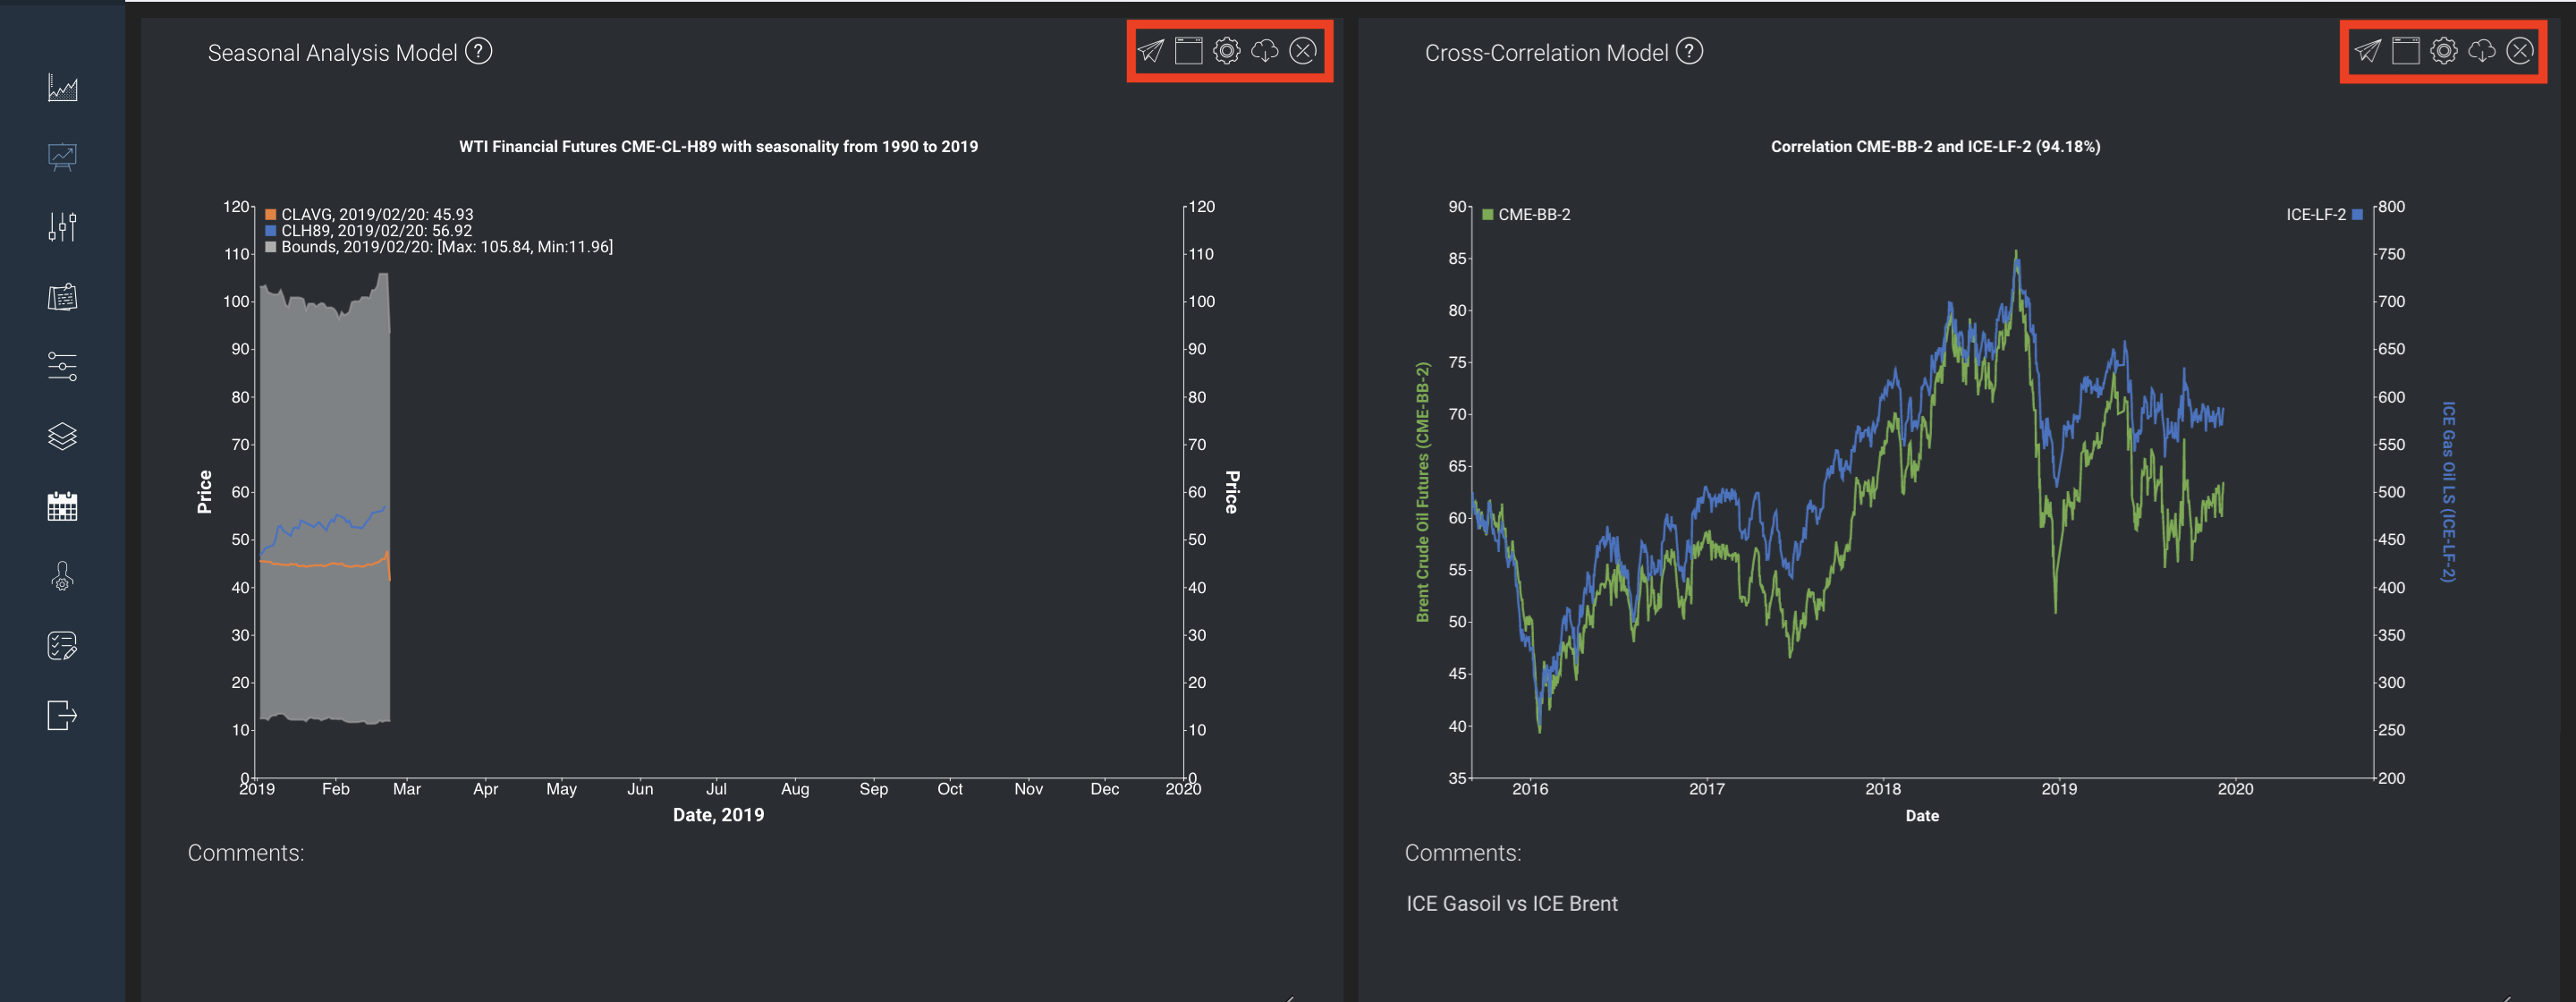
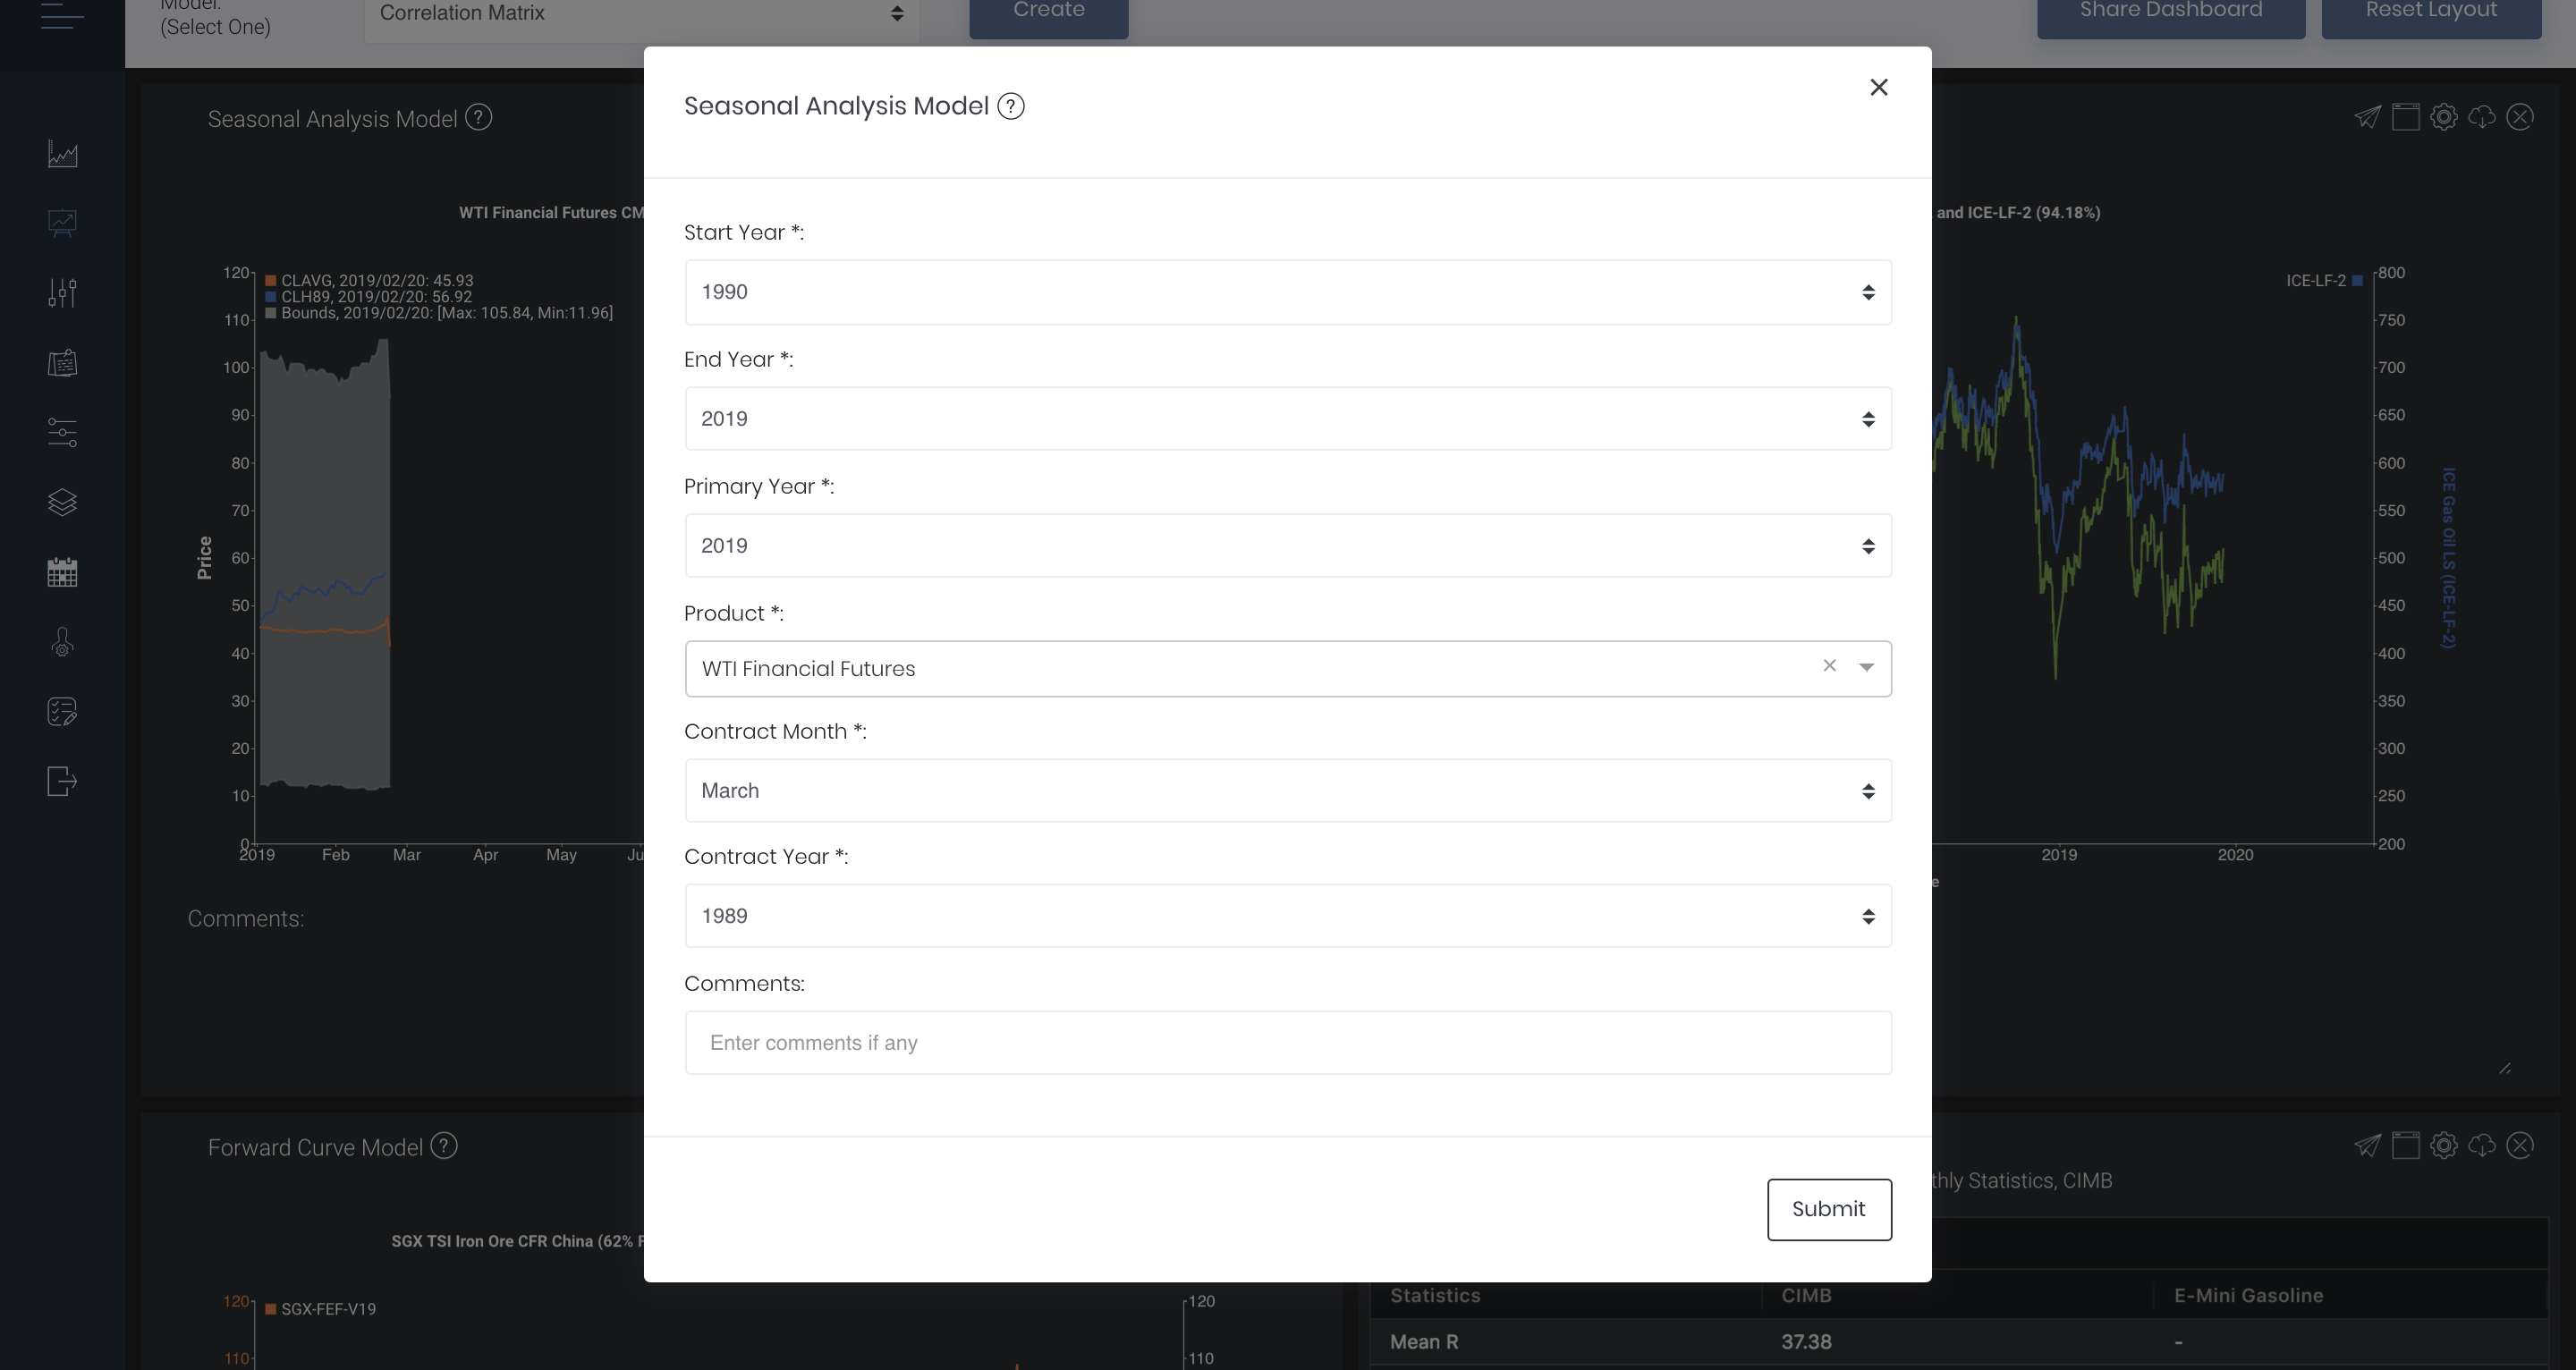
2. Proceed to your 'Dashboard' and the chart you have added from the 'Featured Charts' page will be displayed. You will be able to edit the input settings according to your needs by clicking on the 'gear' icon ![]() .
.
Legend
| Icon | Description |
|---|---|
| Share this chart with anyone! Click to copy the link of this chart into your clipboard and anyone with the link will be able to access the chart. The link will expire in 12 hours. |
| Add this chart into your 'Dashboard'. After adding the chart, you will be able to view and edit the chart in your 'Dashboard'. | |
| Open this chart in a new pop-up window. | |
| View the input details of the chart (eg. product name, formula etc). | |
| Export chart as a .CSV or an image file. |
Click to access: