Return to Overview
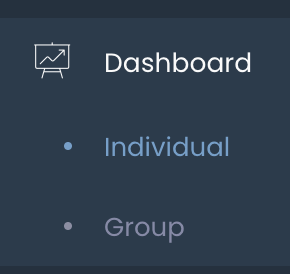
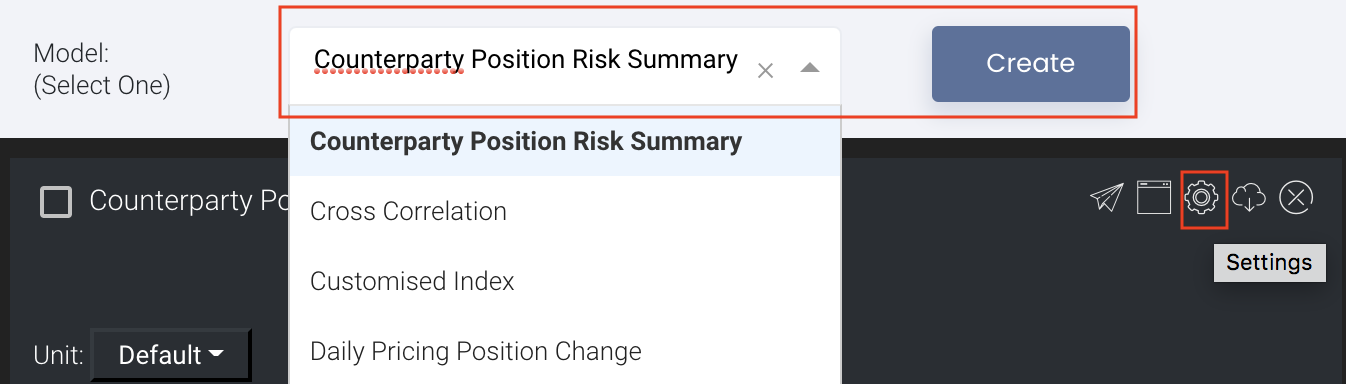
To access the quantitative model/report, click on 'Dashboard' from the navigation sidebar on the left. Select the model/report from the drop-down list and click 'Create'. Click on the 'Settings' button (gear icon) at the top right corner of the model to set up your model/report.
About
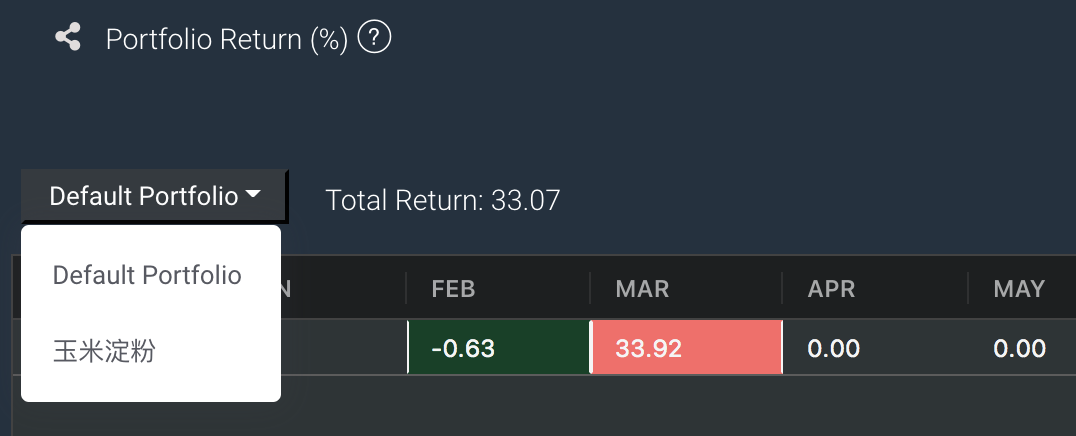
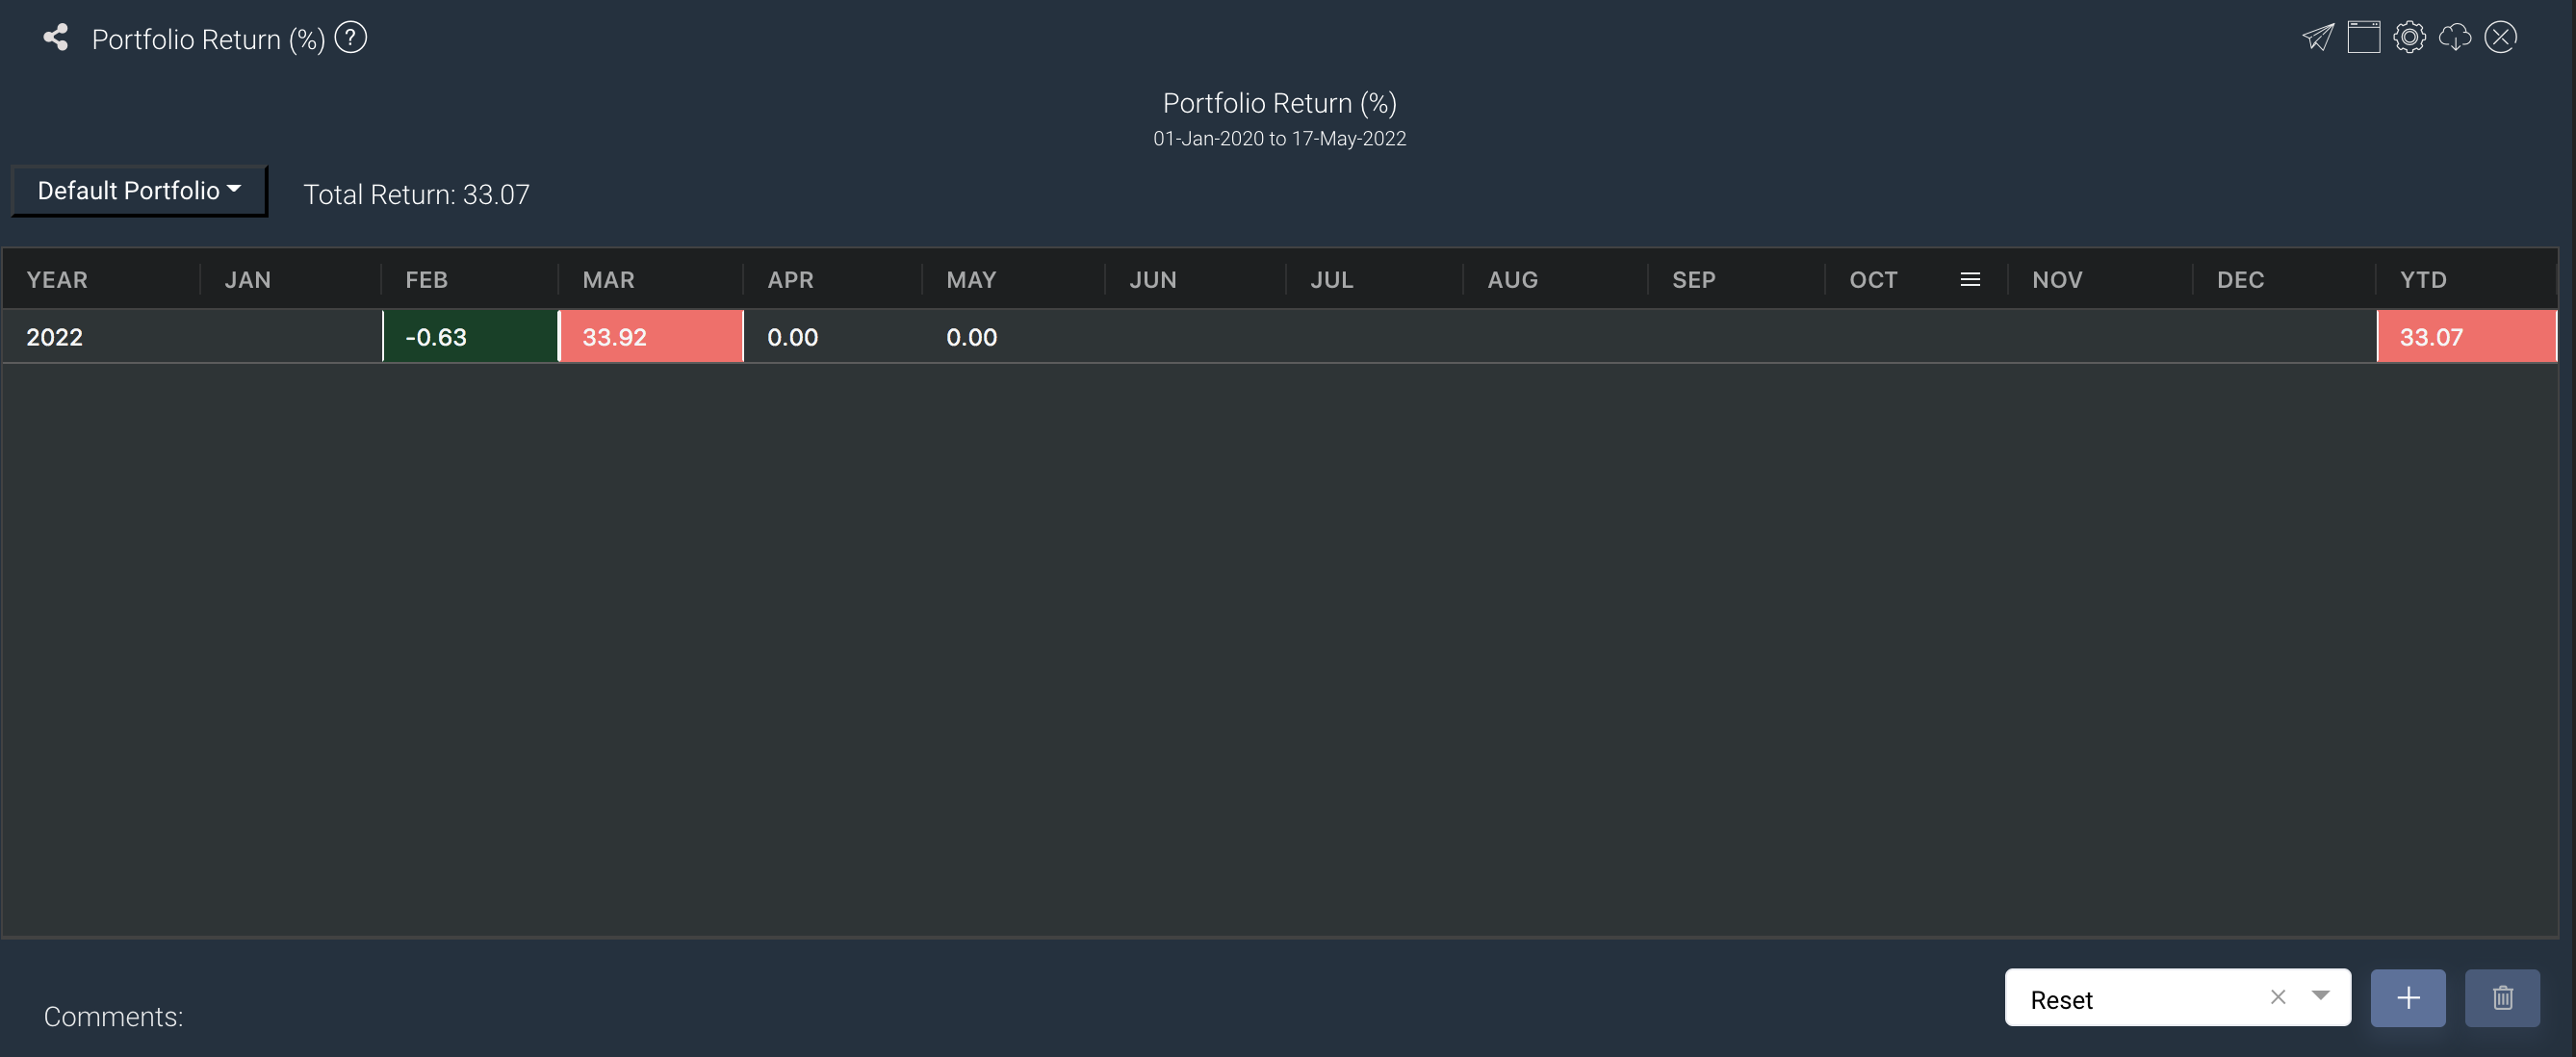
The Portfolio Return table allows the user to view the monthly returns of the portfolio categorised according to years, expressed in percentage form. If the returns are positive values, they will be shown in red. If the returns are negative values, they will be shown in green.
Navigation
To access the quantitative model/report, click on 'Dashboard' from the navigation sidebar on the left.
Select the model/report from the drop-down list and click 'Create'. Click on the 'Settings' button (gear icon) at the top right corner of the model to set up your model/report.
Sharing Model/Report/Dashboard
To share the model with your group members, click on the "Share" button next to the Title of the model followed by the email address of the group members you want to share it with. Once submitted, the model will appear in the Dashboard>Group Dashboard of the selected group members.
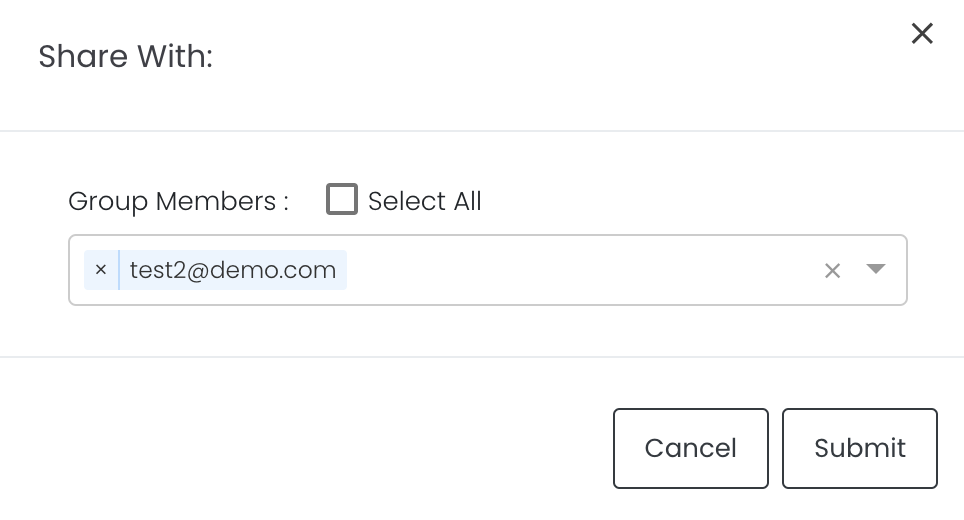
This is different from sharing individual or entire Dashboard models/reports, which allows any user who may or may not be users of MAF Cloud to access the individual model/entire dashboard via the shared web link (link will expire in 8 hours). In Group Dashboard, only group members can access the shared models/reports.
Guide
| Name | Image/Description |
|---|---|
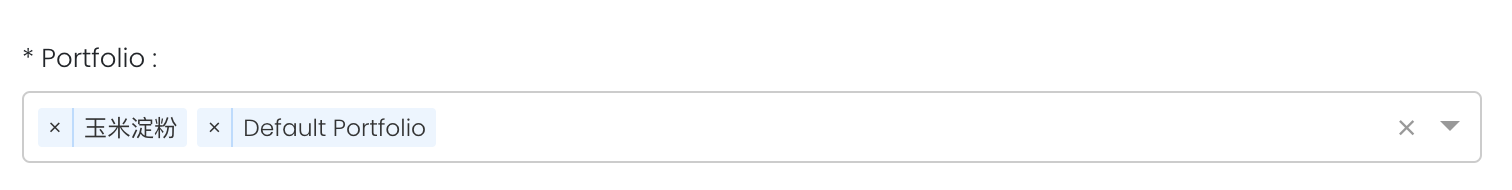
| Portfolio |
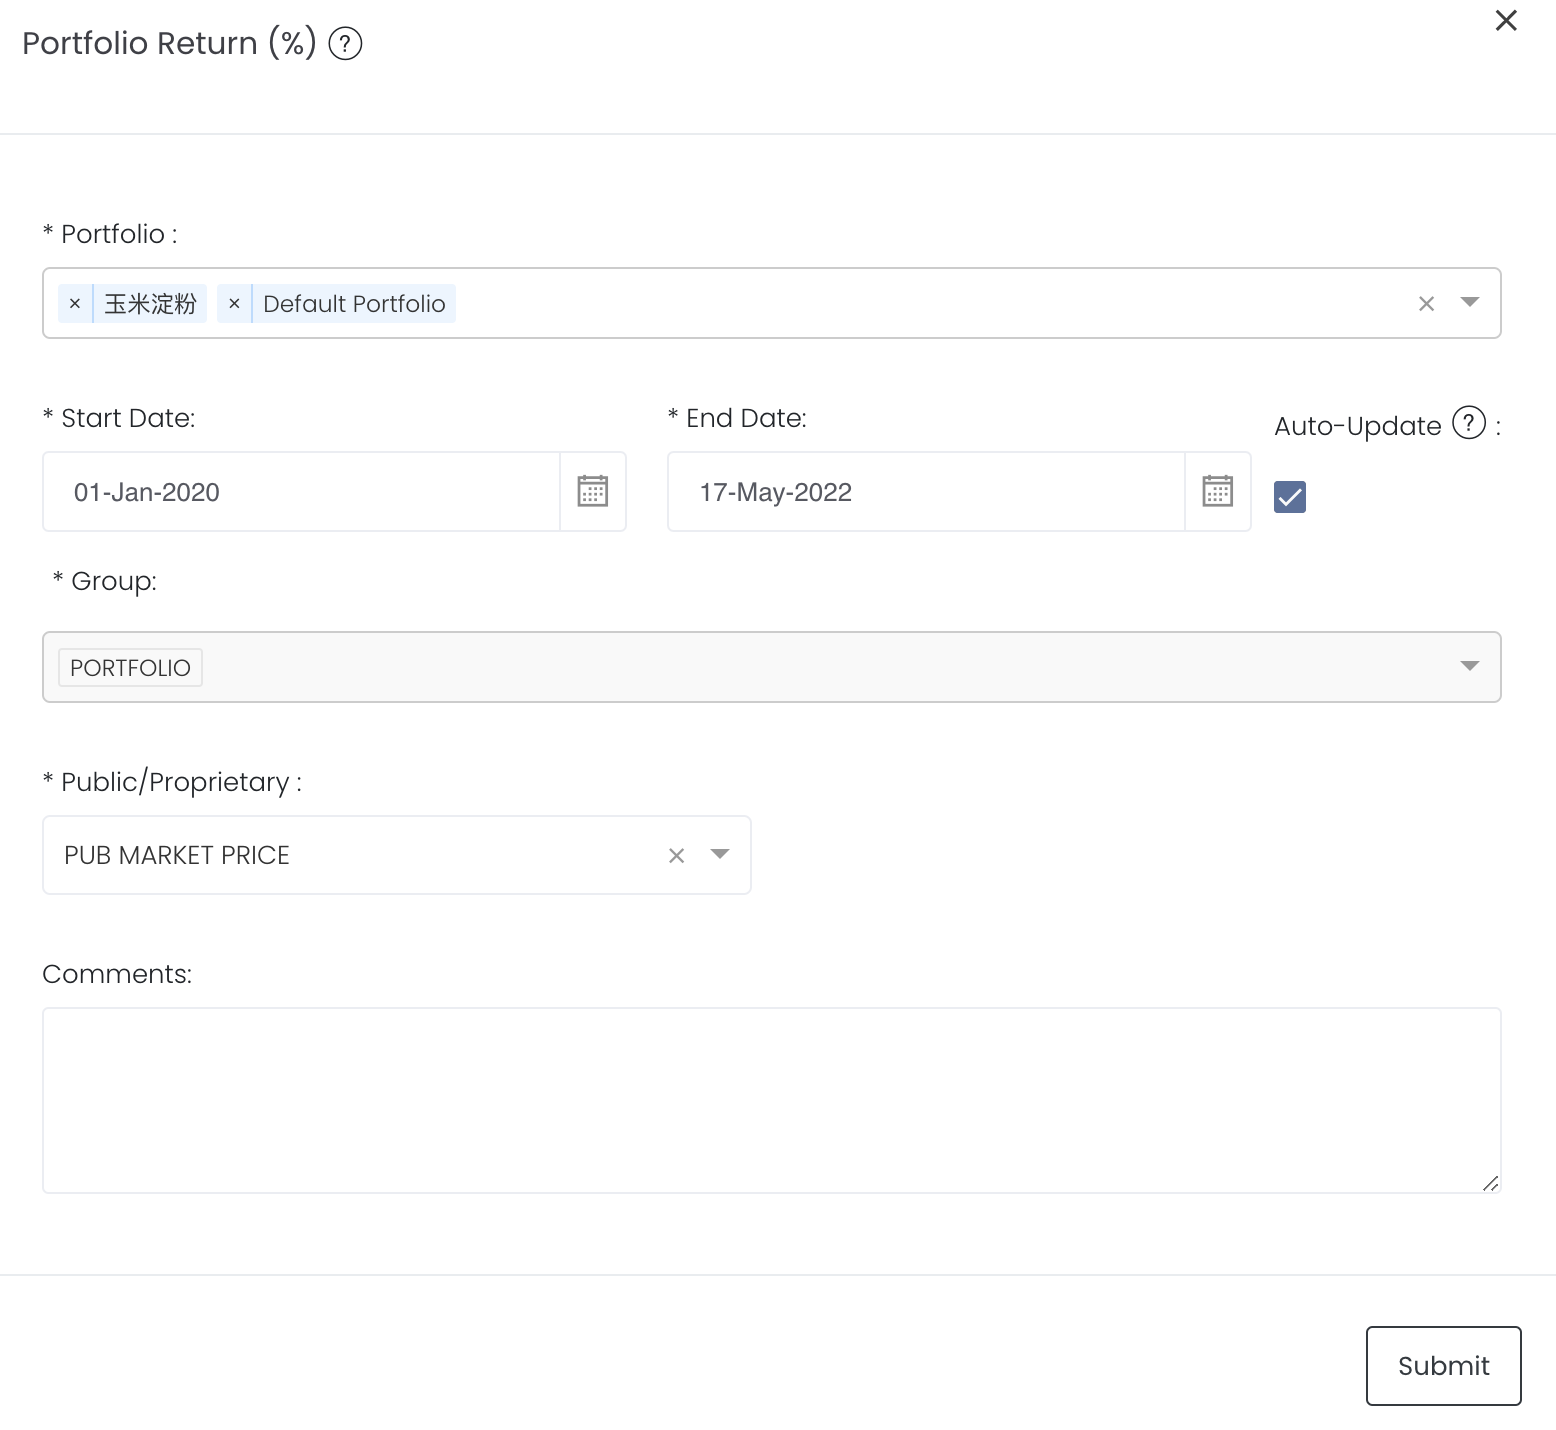
Select a/multiple portfolio(s) of interest. If multiple portfolios are selected and submitted, you may select the portfolio from the dropdown list in the app to view its returns over the months/years.
|
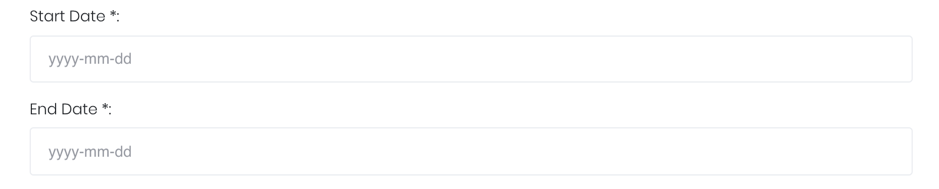
| Duration |
Select the start and end date. |
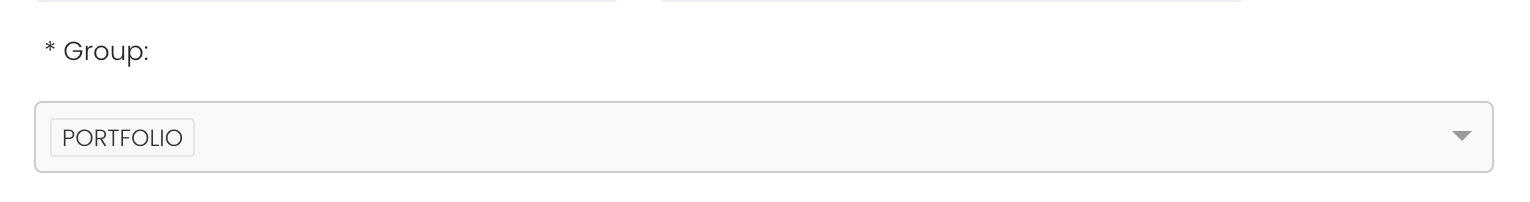
| Group |
The group category will be Portfolio by default. |
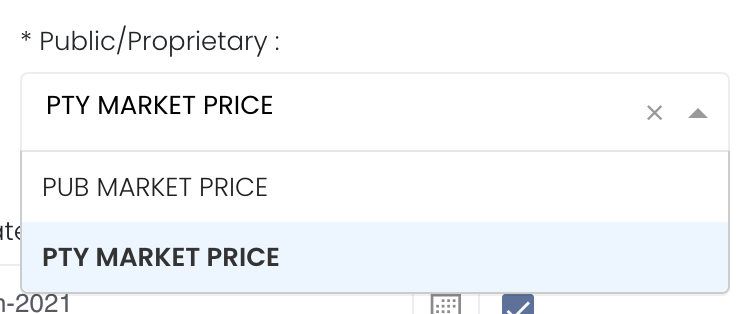
Select public market data or proprietary market data to determine the market data prices used to calculate the P/L or positions accordingly. Please note that if the proprietary (private) market data for certain dates are not input here eg 1 May to 10 May price is input but not 9 May, when you select private data when viewing the portfolio and using the models in Dashboard (eg for trades with trade date on 9 May but private data is not available), the system will use the latest date's settlement price (10 May) to perform the calculations. | |
| Comments |
The inserted comments will be displayed at the bottom of the application. This can be useful for documentation purposes or for settings description. |
Input
| Name | Description | Type | Example |
|---|---|---|---|
| Portfolio | Portfolio selected | Portfolio | ABC |
| Start Date | Start of product time-series. | Date (YYYY-MM-DD) | 2015-06-01 |
| End Date | End of product time-series. | Date (YYYY-MM-DD) | 2019-06-14 |
| Comments | Useful for documentation purposes or for settings description. | Text | - |
Output
Name | Description | Type |
|---|---|---|
| Table | Performance returns in percentage (%) form | Plot |
| Select Portfolio to display returns | If multiple portfolios are selected and submitted in the settings, you may select the portfolio from the dropdown list in the app to view its returns over the months/years. If the returns are positive values, they will be shown in red. If the returns are negative values, they will be shown in green.
| - |
Example
Functionality
Please refer to Table Settings for table functionalities.
Definition of Terms
Please refer to List of Definitions: Trades.
Click to access: