Return to Overview
Table of Contents maxLevel 2 minLevel 2 type flat separator pipe
...
Please note that for the details in the app to appear, you will need to click on the "Save" button at the bottom left of the Group P/L app. The End Date of the Group P/L app are critical in determining the data to be displayed. Once you select your End Date in the settings of Group P/L app, click on the "Save" button and open the Historical Group P/L app. If the date range in Historical Group P/L app is within the date range selected in the Group P/L app, the End Date of the saved data in Group P/L app will appear as a row in the Historical Group P/L app and the relevant data will be calculated and displayed accordingly.
To categorise the trades according to your needs, you can reorganise your data by dragging-and-dropping the columns at the top of the table to 'set row groups'. Columns like daily change in P/L, commission and expenses/income will be summed up accordingly.
The 'Start Date' will be 1st day of the year (1 Jan 2021) by default and 'End Date' will be today's date by default. You can select the cut-off date ('End Date') to determine your P/L for that period and the close/settlement date of each trade is crucial as it will determine which month/year's P/L it will belong to.
The rows are the various categories of assets in the portfolio while the columns indicate product information such as portfolio name, trader and total P/L. The table acts like a pivot table and can be categorised and organised by groups according to your needs. You can click here to learn how to customise the table by arranging and filtering the columns based on your preference, and saving the table layout(s) as a template. Also see Futures Contracts Codes for more information on exchange and month codes, if required.
Note: For expense/income items to appear in the expense/income column, you will be required to select the contract number to be linked to the specific expense/income item in the expense/income table.
This app is similar to Group P/L but without:
...
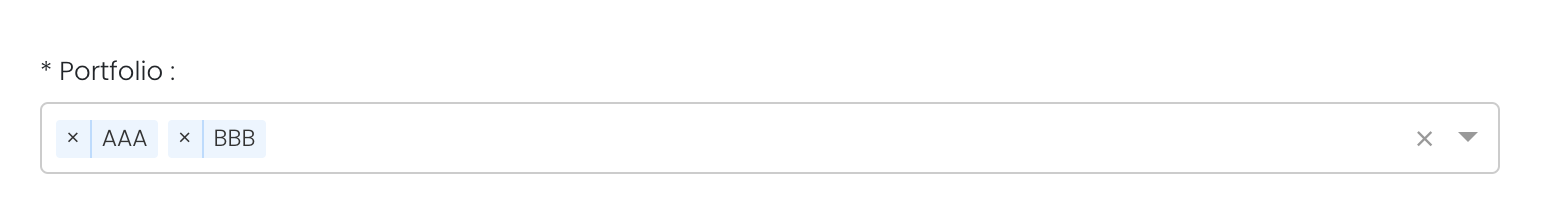
Portfolio |
Select a portfolio of interest. You may select multiple portfolios to be displayed in the model. |
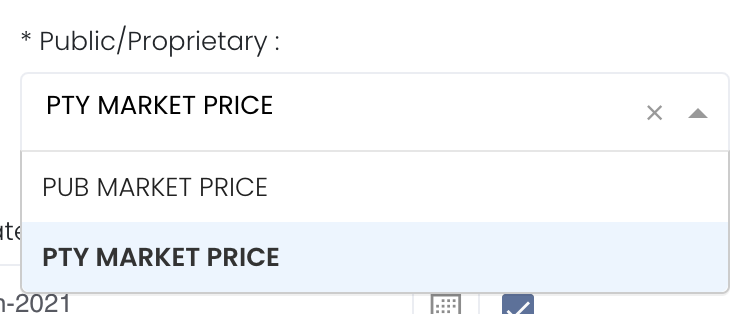
Select public market data or proprietary market data to determine the market data prices used to calculate the P/L or positions accordingly. Please note that if the proprietary (private) market data for certain dates are not input here eg 1 May to 10 May price is input but not 9 May, when you select private data when viewing the portfolio and using the models in Dashboard (eg for trades with trade date on 9 May but private data is not available), the system will use the latest date's settlement price (10 May) to perform the calculations. | |
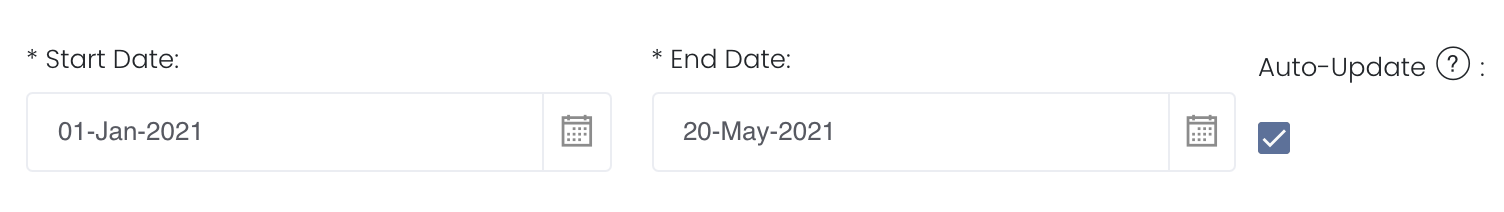
Duration |
Select the start and end date to determine the range of period and cut-off date for the calculations of P/L. Start Date will be the start of the year (eg 1 Jan 2021) by default. End Date will be yesterday's date by default. End Date cannot be today's date. You are free to edit the dates as necessary. Auto-Update Tick: Resets the dates to default once you leave the ‘Dashboard’ page. Untick: Dates according to your settings remain unchanged once you leave the ‘Dashboard’ page. |
| Group | Select PORTFOLIO, CATEGORY or TRADER or STRATEGY or COMPANY and the columns will appear accordingly in the model. If it is not selected, the columns will not appear. PORTFOLIO is a compulsory field to be included
|
| Days | |
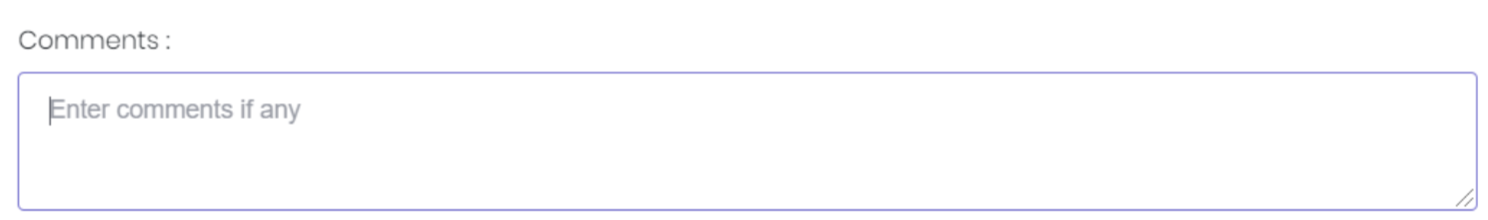
Comments |
The inserted comments will be displayed at the bottom of the application. This can be useful for documentation purposes or for settings description. |

...