Inventory Summary
Return to Overview
About
The Inventory Summary app provides an overview of the outstanding stock in and stock out inventory of all of your physical trades based on the contract and actual quantity of your stock, as well as futures positions. It allows you to view your inventory summary based on "Contract" or "Title Transfer Date" as well as "Last Week" or "Last Month" inventory stock count.
Please note that Scope 操作范围 in the Stock Management function is a key value to calculating “STOCK QTY” in this “INVENTORY SUMMARY” app. Only “EXTERNAL” row qty will be used to sum up.
Scope 操作范围: Used to identify if the transaction is from/to external party/counterparties (real delivery) or action internally/in-house stock action. It will be used for calculating the stock in/stock out quantity from/to external party.
External: Any purchase or sale transaction with external party/stock in/out from counterparties
Internal: Everything else not mentioned in External/in-house stock action e.g., change from warrant to physical cargo or change warehouse etc
It is a key value to calculate
You can click here to learn how to customise the table by arranging and filtering the columns based on your preference, and saving the table layout(s) as a template.
Navigation
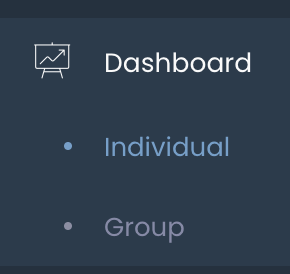
To access the quantitative model/report, click on 'Dashboard' from the navigation sidebar on the left.
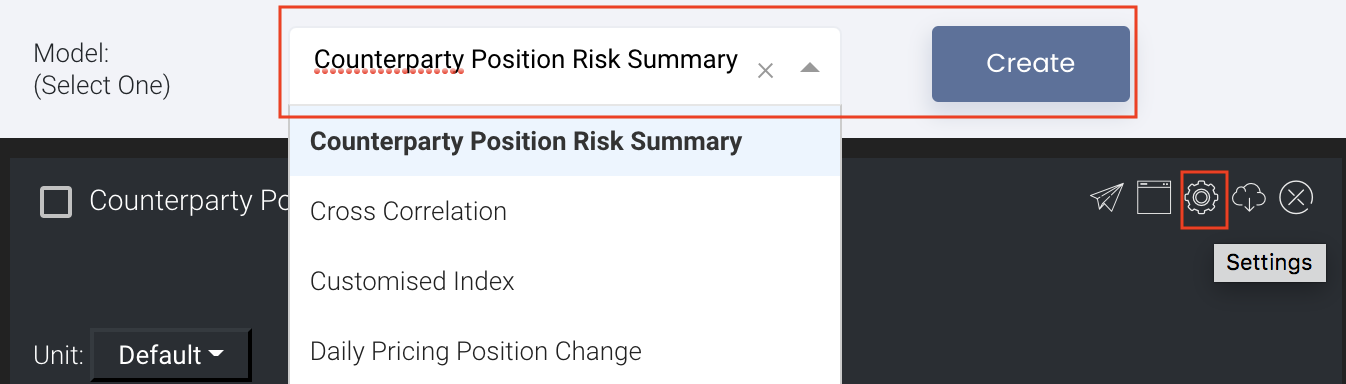
Select the model/report from the drop-down list and click 'Create'. Click on the 'Settings' button (gear icon) at the top right corner of the model to set up your model/report.
Sharing Model/Report/Dashboard
To share the model with your group members, click on the "Share" button next to the Title of the model followed by the email address of the group members you want to share it with. Once submitted, the model will appear in the Dashboard>Group Dashboard of the selected group members.
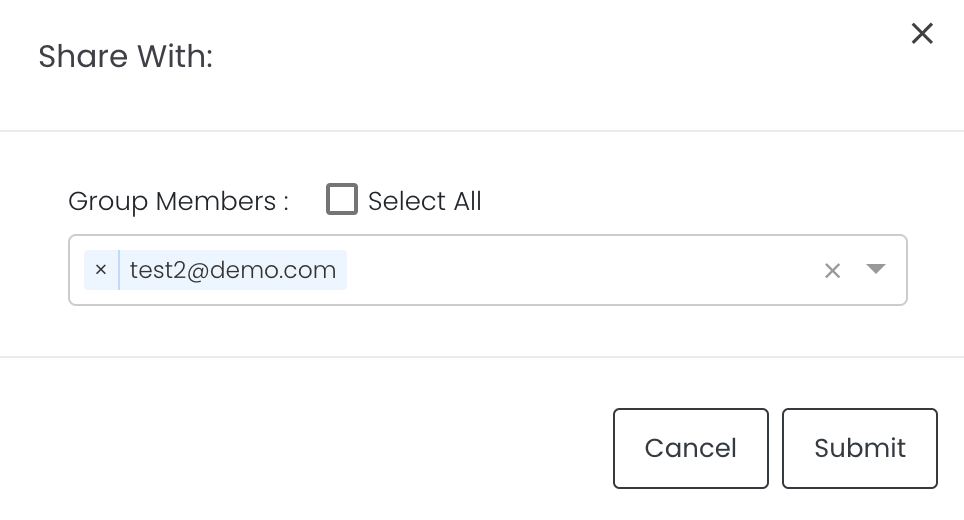
This is different from sharing individual or entire Dashboard models/reports, which allows any user who may or may not be users of MAF Cloud to access the individual model/entire dashboard via the shared web link (link will expire in 8 hours). In Group Dashboard, only group members can access the shared models/reports.
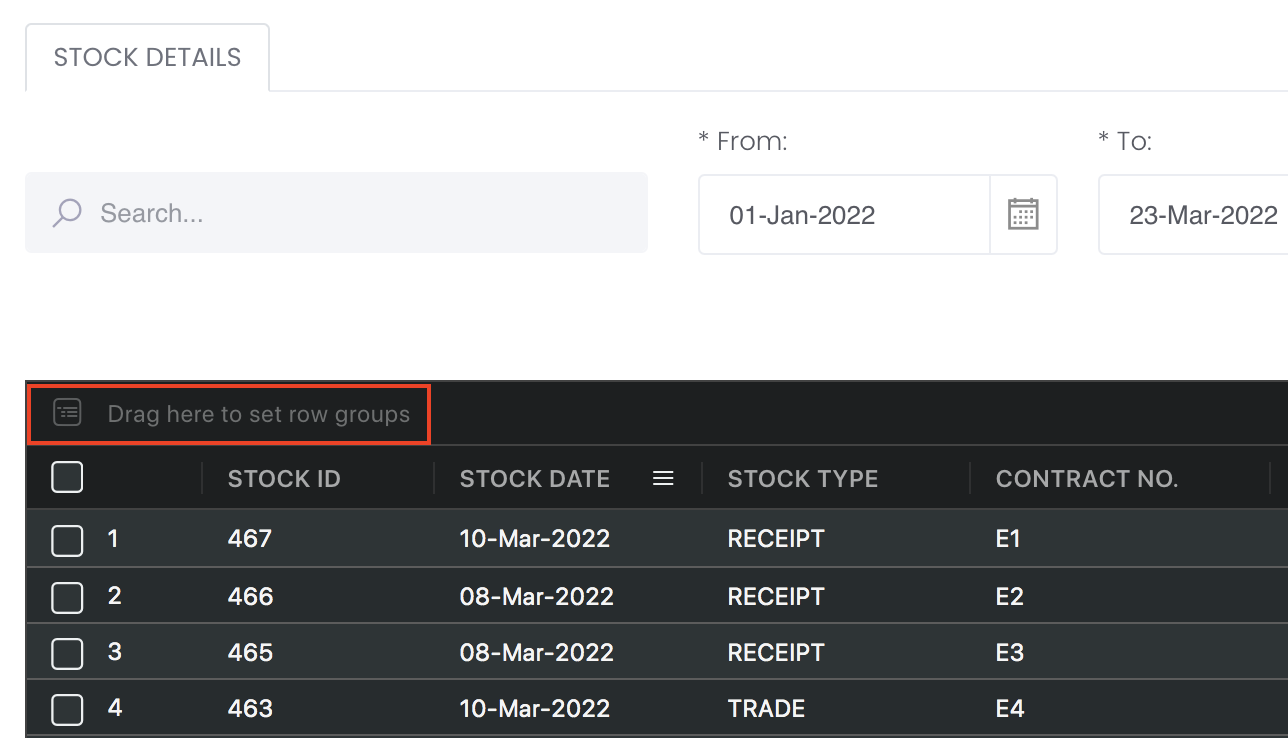
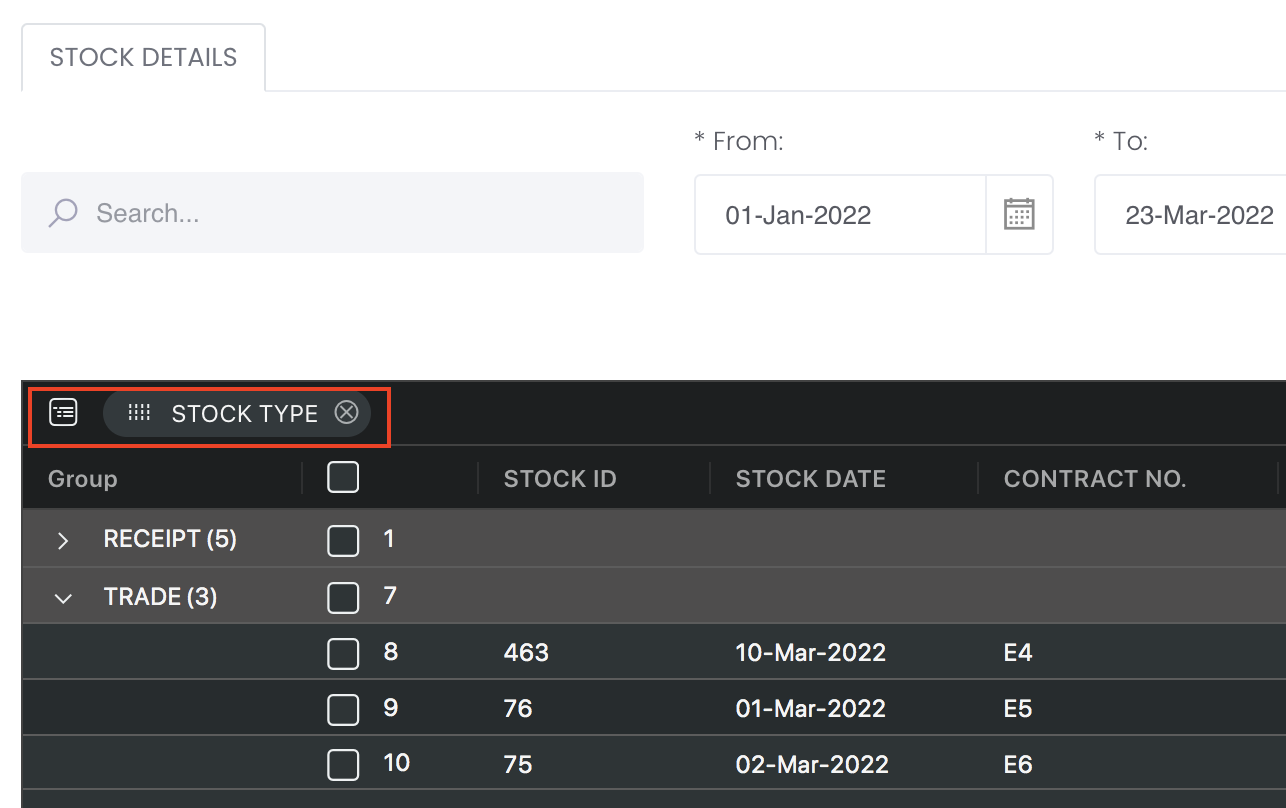
Group Rows
You may also group the rows (liken to the pivot table function in Microsoft Excel) to view the grouped data by dragging any column headers into the “row groups” section as highlighted:
Guide
Name | Images/Description |
|---|---|
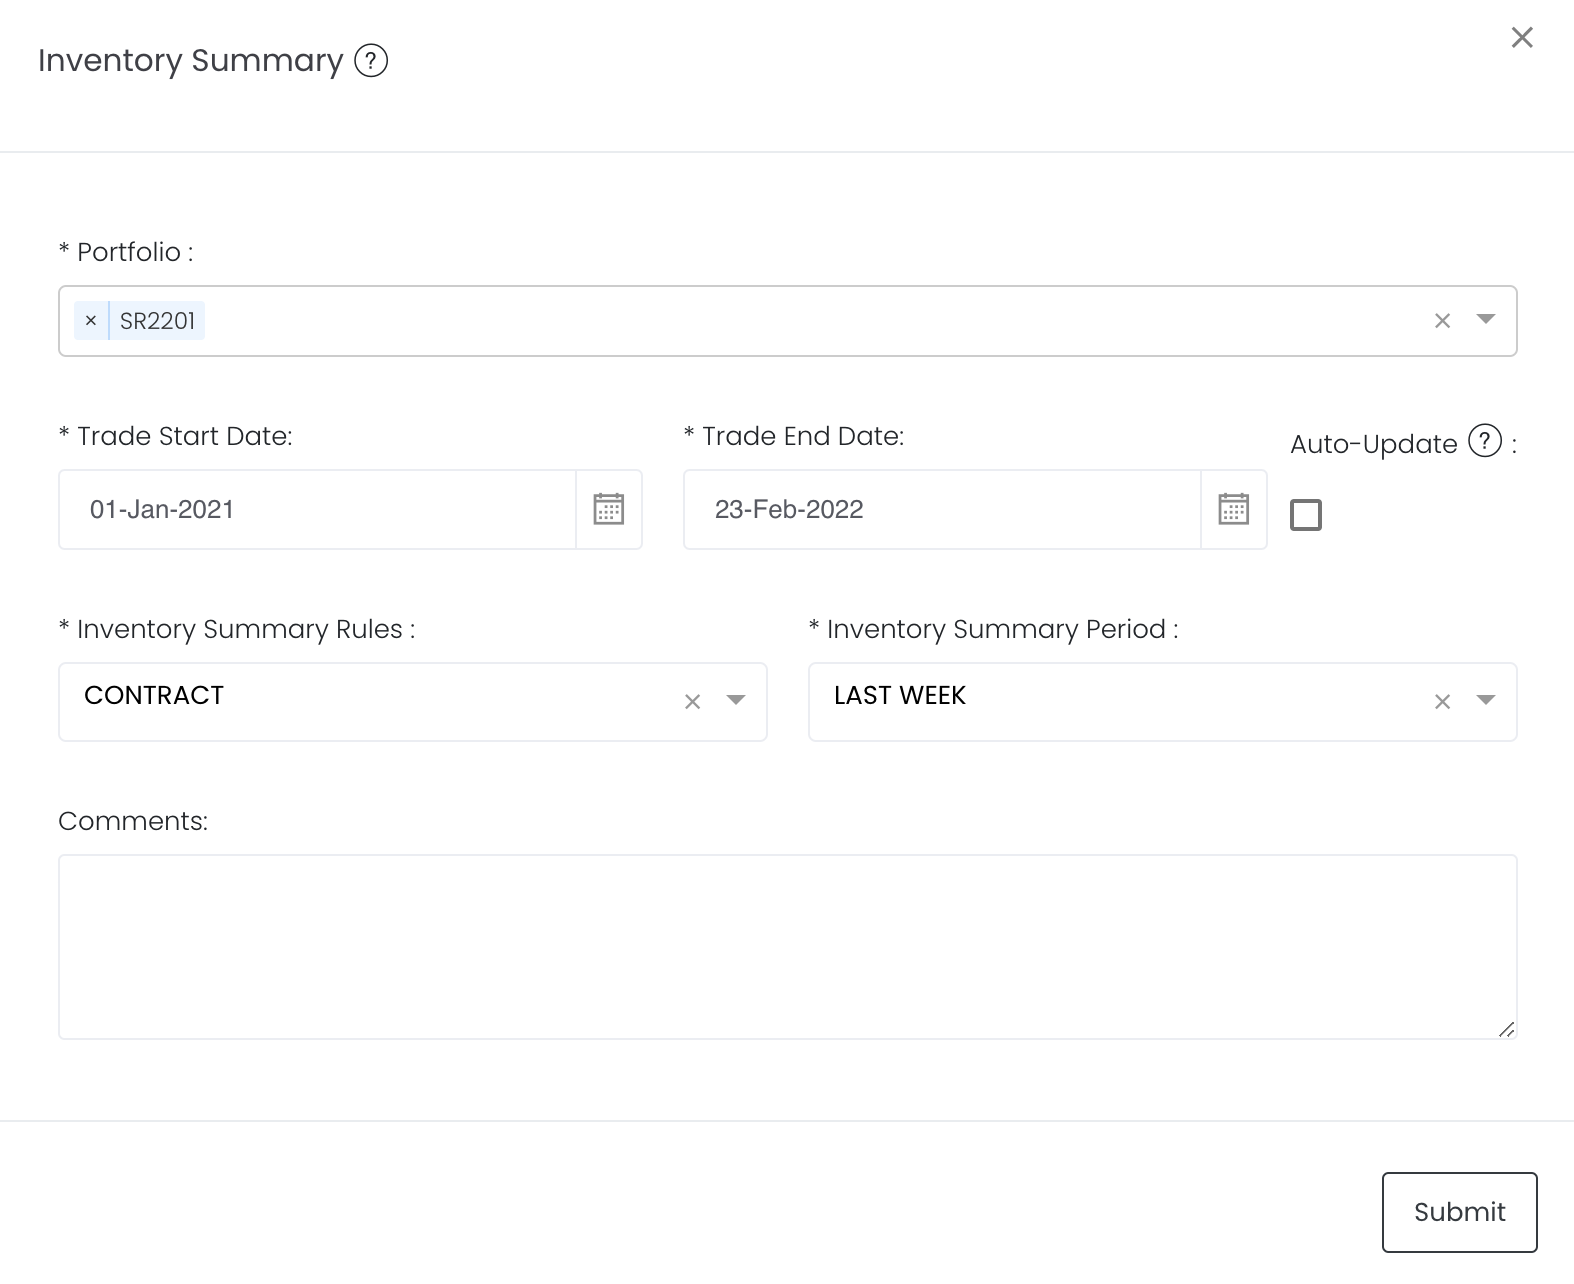
| Portfolio |
Select a portfolio of interest. |
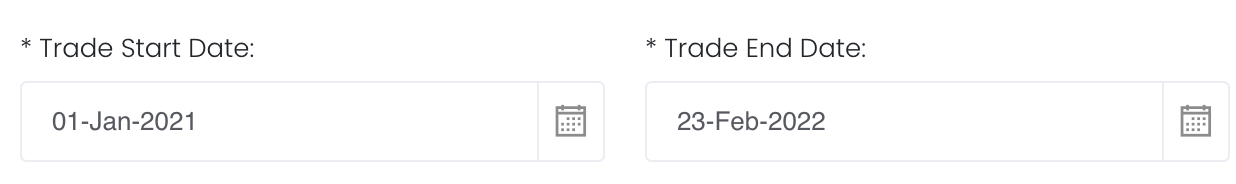
| Duration |
Select the start and end date to determine the range of period and cut-off date for the computation of outstanding quantity Start Date will be the first day of the year by default. After changing the start date, the app will retain the start date until you log out. End Date will be yesterday's date by default. You are free to edit the dates as necessary. Auto-Update Tick: Resets the dates to default once you leave the ‘Dashboard’ page. Untick: Dates according to your settings remain unchanged once you leave the ‘Dashboard’ page. |
| Inventory Summary Rule | Select:
Default will be "Contract". |
| Inventory Summary Period | Select:
Default will be "Last Week" |
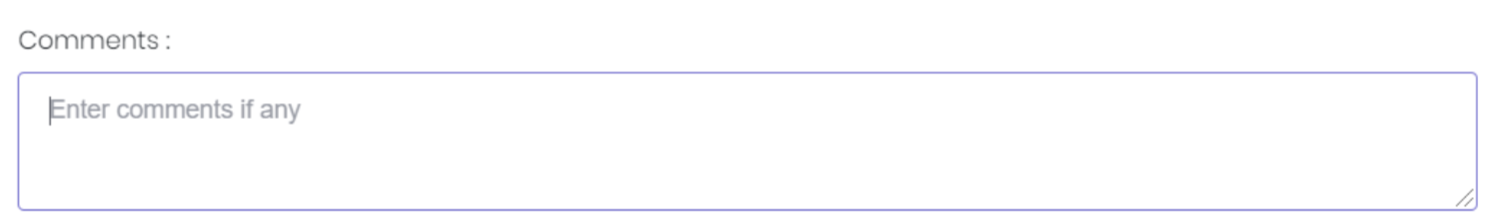
Comments |
The inserted comments will be displayed at the bottom of the application. This can be useful for documentation purposes or for settings description. |

Input
Name | Description | Type | Example |
|---|---|---|---|
| Start Date | Start of product time-series. Empty by default, you are free to fill in as necessary. | Date (YYYY-MM-DD) | 2015-06-01 |
| End Date | End of product time-series. Today's date by default. | Date (YYYY-MM-DD) | 2019-06-14 |
| Auto Update | Tick: Resets the dates to default once you leave the ‘Dashboard’ page. Untick: Dates according to your settings remain unchanged once you leave the ‘Dashboard’ page. | Checkbox | - |
| Comments | Useful for documentation purposes or for settings description. | Text | - |
Output
Description | Type | |
|---|---|---|
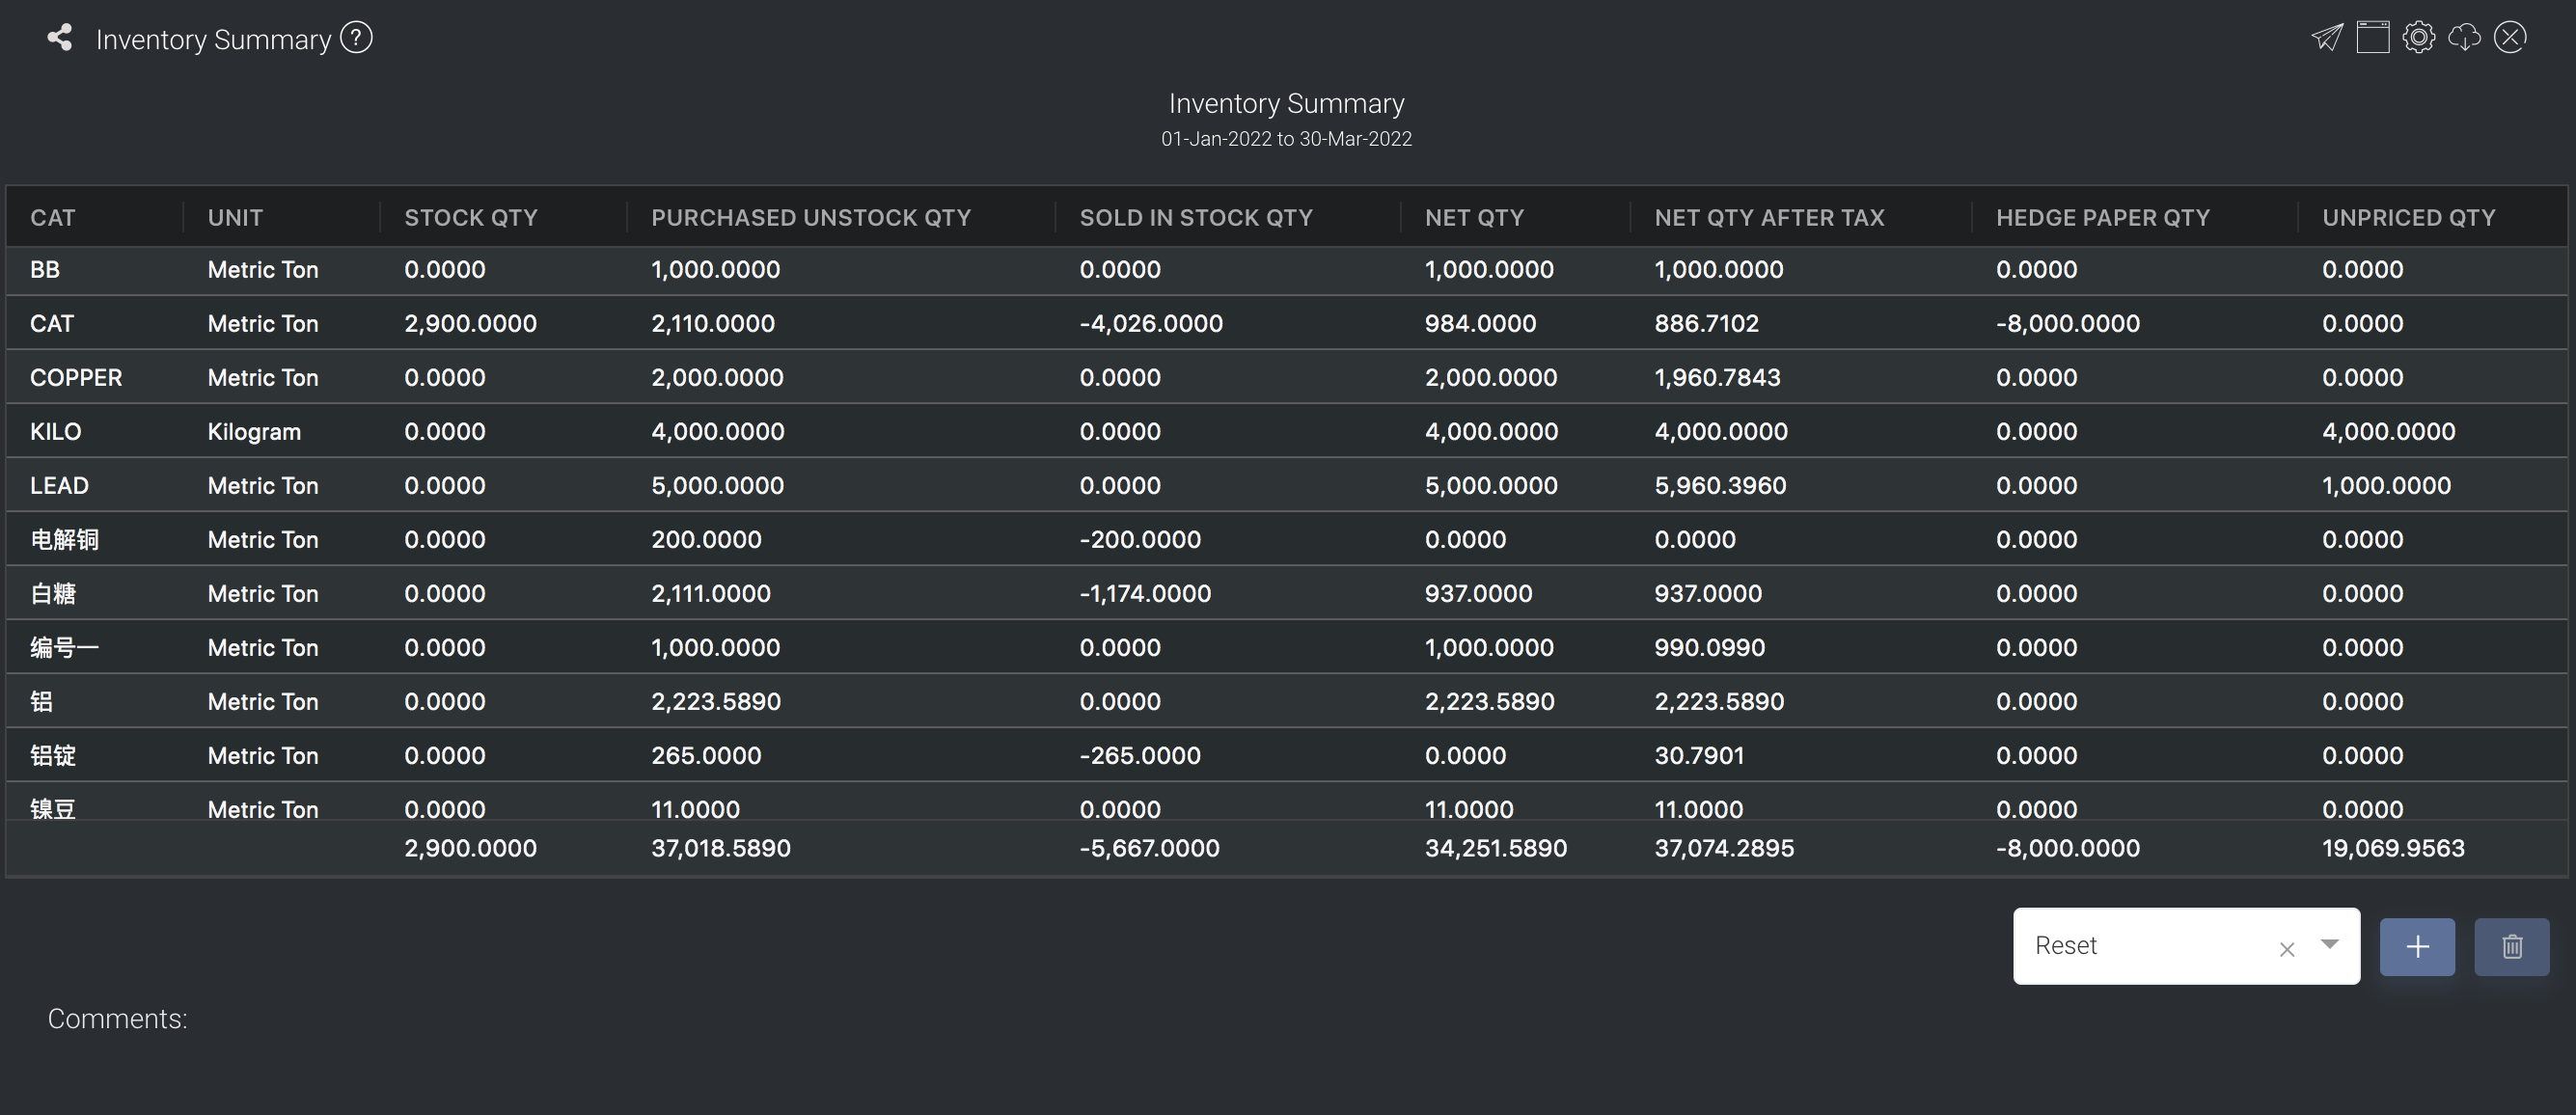
Product/Strategy Information | STOCK QTY: Total quantity that has been stocked in (input in the Trade>Stock Management function). Please note that Scope 操作范围 in the Stock Management function is a key value to calculating “STOCK QTY”. Only “EXTERNAL” row qty will be used to sum up. PURCHASED UNSTOCK QTY: Purchased quantity that has not been stocked in (input in the Trade>Stock Management function) will be displayed here. SOLD IN STOCK QTY: Sold quantity that has been stocked in (input in the Trade>Stock Management function) will be displayed here. NET QTY: Net purchase/sold stock will be calculated and displayed here eg purchase 1000 and sold 2000 so 1000 will be displayed here. NET QTY AFTER TAX: Net purchase/sold stock after tax will be calculated and displayed here. HEDGE PAPER QTY: Stock quantity which has been hedged will be displayed here. UNPRICED QTY: Stock quantity which has no actual price will be displayed here. NET EXP QTY: Net exposure quantity will be the difference between physical and paper stock quantity [] STOCK QTY: Last week or last month stock quantity will be displayed here. LAST WEEK OR LAST MONTH (According to your selection) will appear before STOCK QTY. [] STOCK IN QTY: Last week or last month stock in quantity will be displayed here. LAST WEEK OR LAST MONTH (According to your selection) will appear before STOCK QTY. [] STOCK OUT QTY: Last week or last month stock out quantity will be displayed here. LAST WEEK OR LAST MONTH (According to your selection) will appear before STOCK QTY. You can reorganise your data by dragging-and-dropping the columns at the top of the table to 'set row groups'. | Text |
Example
Functionality
Please refer to Table Settings for table functionalities.
Definition of Terms
Please refer to List of Definitions: Trades.
Click to access: