...
The Portfolio Performance Chart model allows the user to plot various series alongside each other on the same graph, with options to display the group (portfolio, category, trader, strategy or tradercompany) of single or multiple portfolios to view their performance (accumulative Group P/L: only shows last day P/L). It is used to visualise the performance of each portfolio in terms of Group P/L against each other.
...
| Name | Image/Description |
|---|---|
| Portfolio |
Select a/multiple portfolio(s) of interest. |
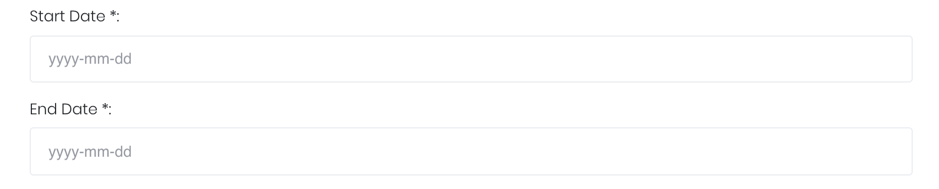
| Duration |
Select the start and end date of the time series. |
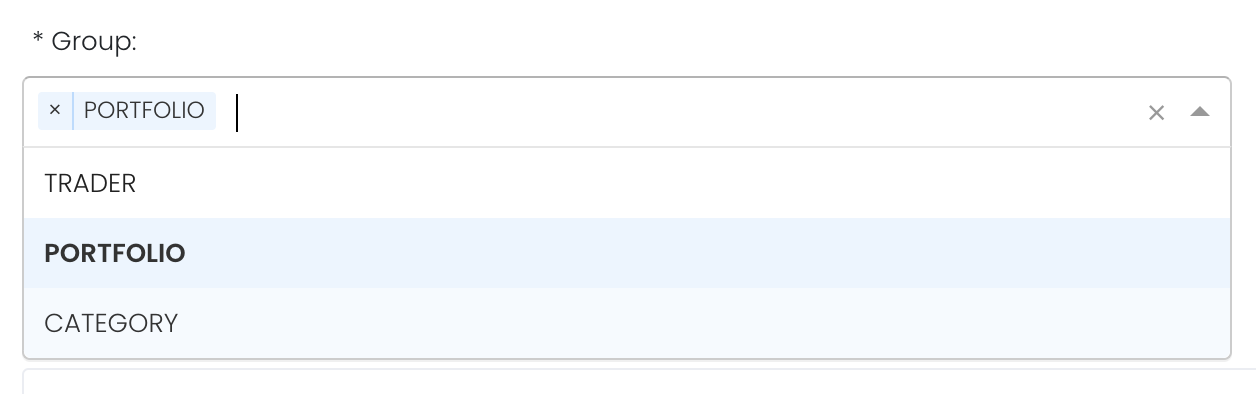
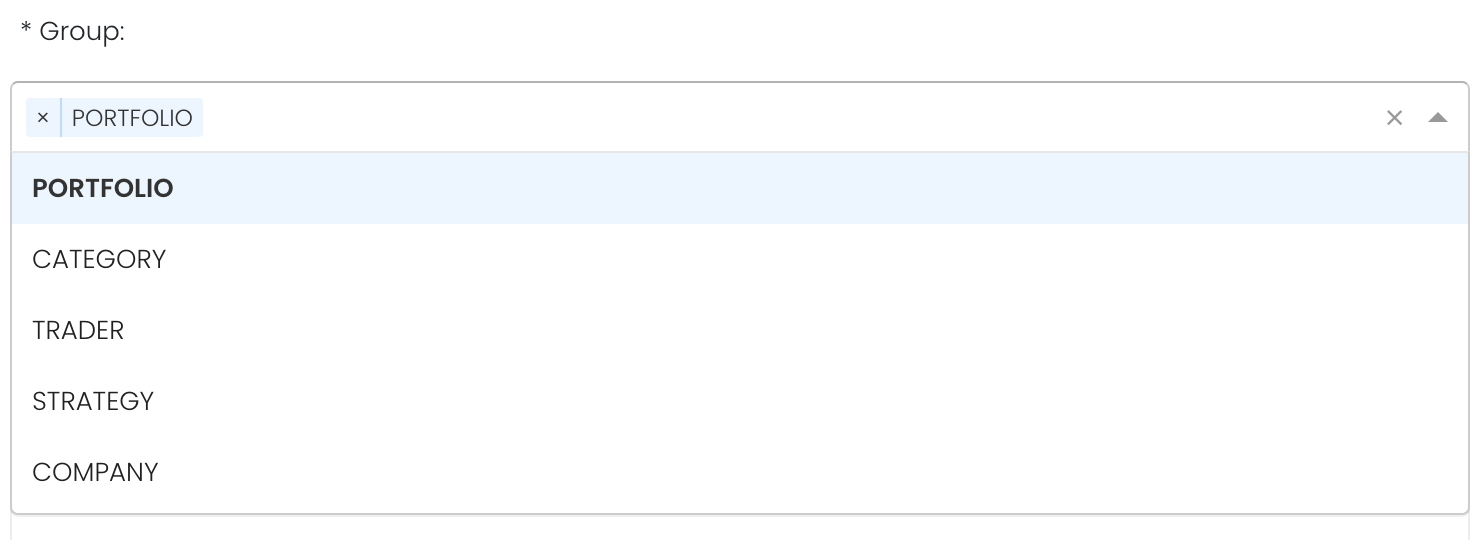
| Group |
Select the group category to show the group P/L of the group category accordingly. PORTFOLIO will be displayed as the default. |
| Comments |
The inserted comments will be displayed at the bottom of the application. This can be useful for documentation purposes or for settings description. |


...