Return to Overview
...
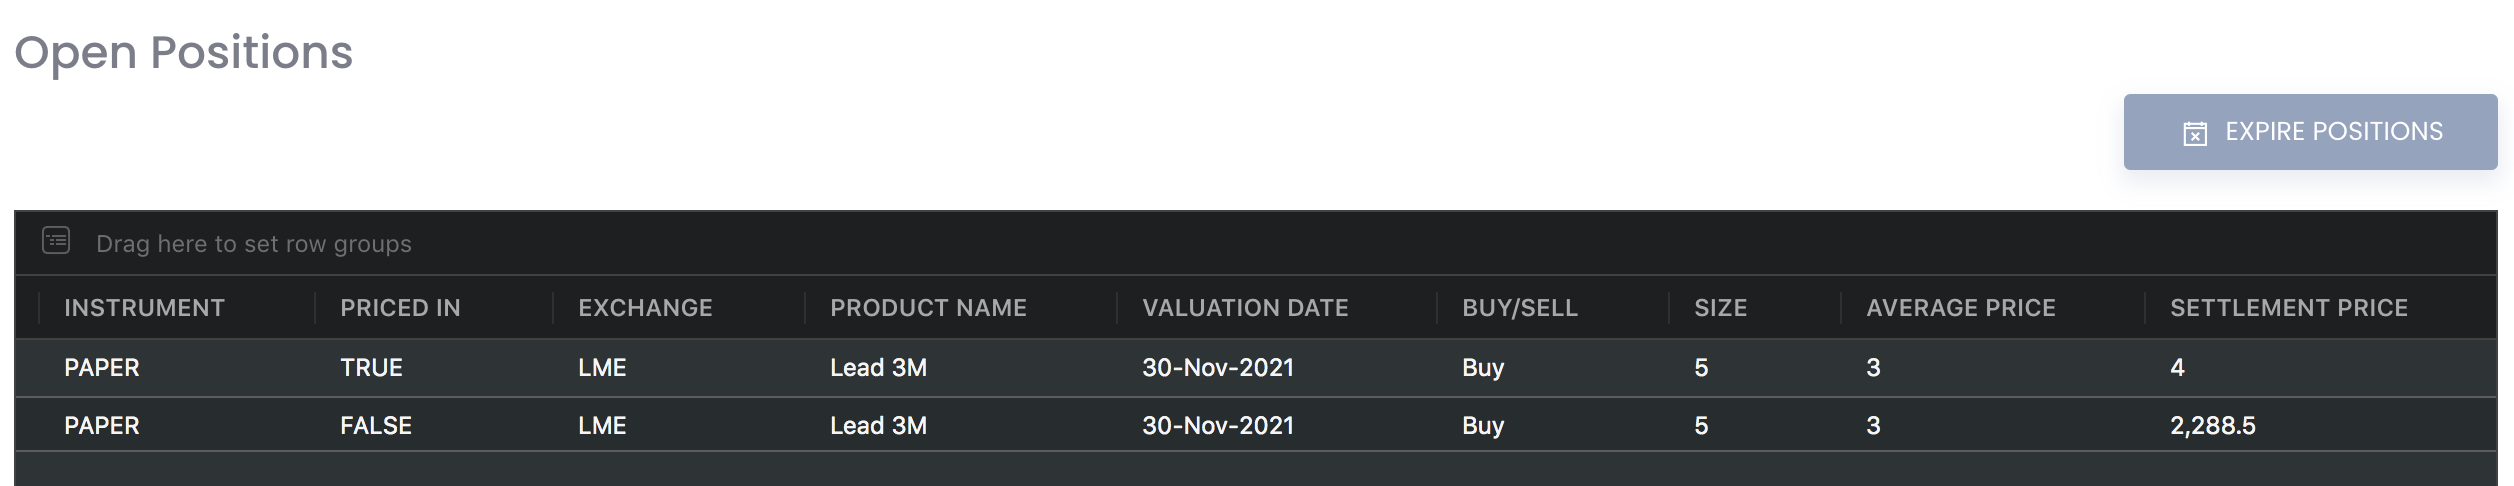
The Open Position Details model is obtained directly from the Open Positions Table in View Portfolio page for you to view all the open positions directly in the Dashboard. To categorise the trades according to your needs, you can reorganise your data by dragging-and-dropping the columns at the top of the table to 'set row groups'. Columns like daily change in P/L, commission and expenses/income will be summed up accordingly.
...
Navigation
To access the quantitative model/report, click on 'Dashboard' from the navigation sidebar on the left.
...
Select the model/report from the drop-down list and click 'Create'. Click on the 'Settings' button (gear icon) at the top right corner of the model to set up your model/report.

Sharing Model/Report/Dashboard
To share the model with your group members, click on the "Share" button next to the Title of the model followed by the email address of the group members you want to share it with. Once submitted, the model will appear in the Dashboard>Group Dashboard of the selected group members.
...
This is different from sharing individual or entire Dashboard models/reports, which allows any user who may or may not be users of MAF Cloud to access the individual model/entire dashboard via the shared web link (link will expire in 8 hours). In Group Dashboard, only group members can access the shared models/reports.
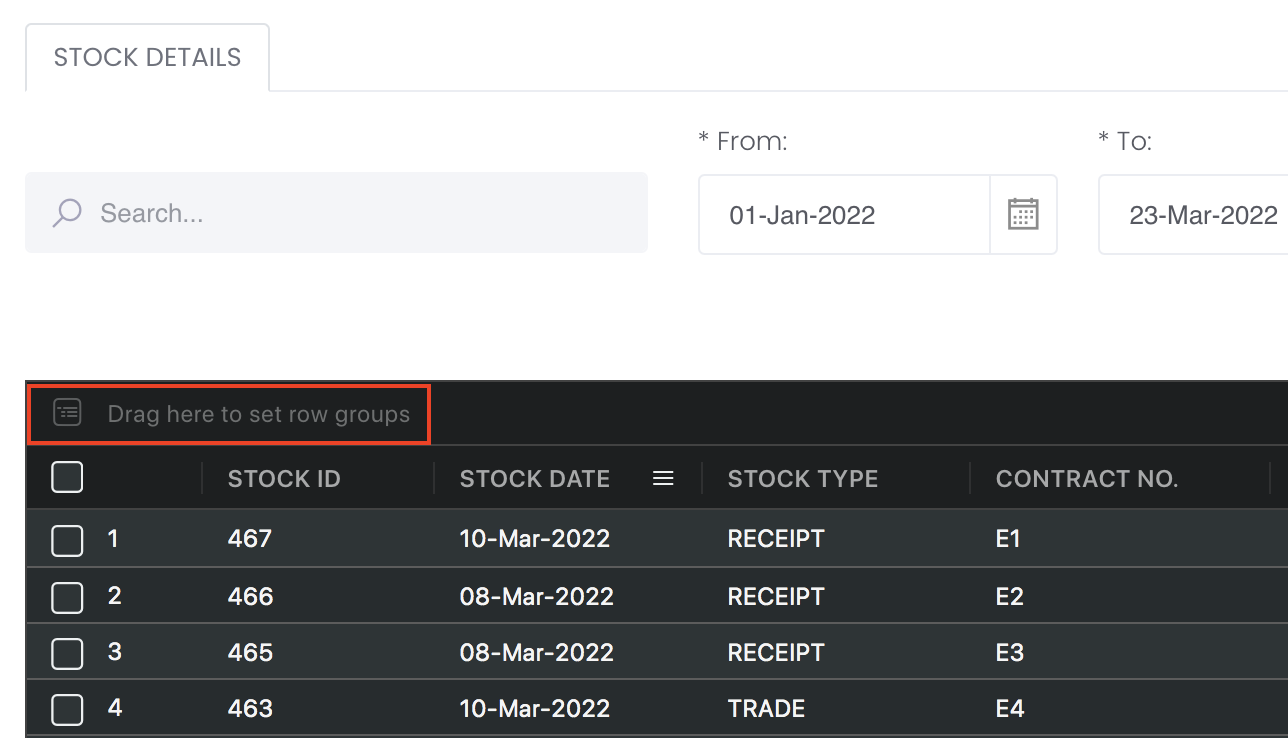
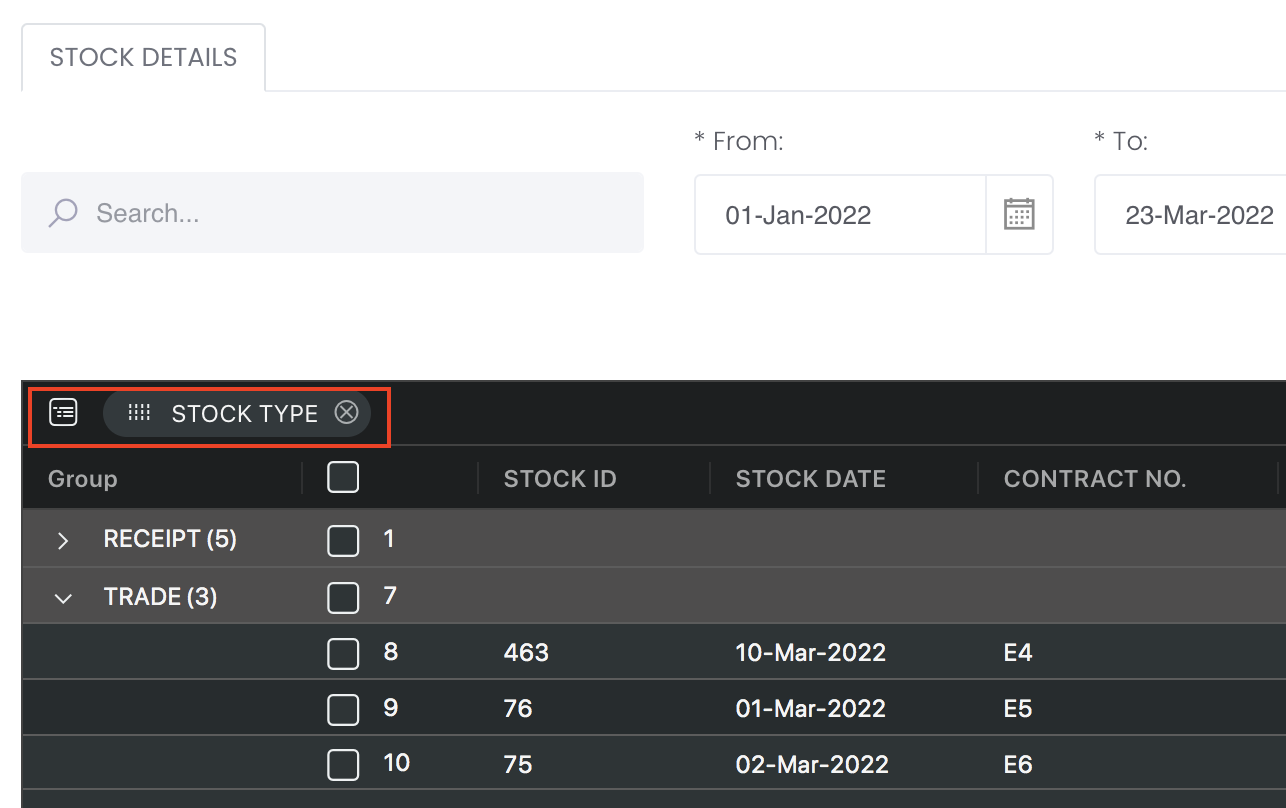
Group Rows
You may also group the rows (liken to the pivot table function in Microsoft Excel) to view the grouped data by dragging any column headers into the “row groups” section as highlighted:
...
The 'Open Positions' table consists of all the open positions in the portfolio (ie. position is 1-sided: only 'buy' or 'sell'). You will be able to monitor the outstanding paper and physical trades which are not closed/completed here. To determine the 'Unrealised P/L' value, UNPL = (Settlement Price - Purchase Price) * Contract Size * Size, where 'Purchase Price' = 'Average Price' in system.
...
For paper trades, if the trade has not been closed (eg sell 2, buy 1 so left with 1 qty), the closed quantity will appear in CLOSED POSITION table and the remaining open quantity will appear in OPEN POSITION table.
For example, buy sell LME Lead 3M contract, input trade date as 22 Nov, value date as 30 Nov; buy 10 lot at $3, sell 5 lots at $4. In portfolio, it will be displayed like this: first row will be the net buy and sales of 5 lots at $3 and $4. The remaining lots will be shown in the 2nd row.
Please refer to List of Definitions: Portfolio Details for more details.
...