...
Displayed below are some noteworthy user interactions you can find on this application.
| Name | Description | Interaction |
|---|---|---|
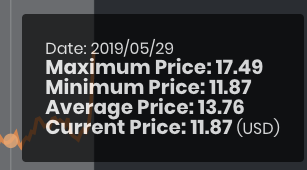
| Tooltip lines (Vertical) | Show cursor position along the X-axis ('Date'). Circles appear on the various time-series, and a tooltip displays all the price values (minimum, maximum, average and current).
| Plot elementElement |
| Legend, Bounds | The minimum and maximum of the product's value on the latest date in previous years are shown in the legend at the top of the Y-axis on the left. | Plot elementElement |
...
Click to access:
| Page Tree |
|---|