...
The Efficient Frontier shows the set of optimal portfolios that offer the highest expected return for a defined level of risk, or the lowest risk for a given level of expected return (the constituent assets in the portfolio are selected by the user in the Create Portfolio section).
The model will simulate a large number of portfolios by randomly assigning different weights to each asset in the user's portfolio, calculating the volatility, return and Sharpe ratio for each simulation. These portfolios will be plotted as points on a scatter-plot, with the annualised expected return on the vertical axis and volatility on the horizontal axis. The Sharpe ratio of the points are colour-coded according to a colour legend. The efficient frontier (which envelopes the points) is also calculated and shown.
...
| Name | Description | Interaction |
|---|---|---|
| Multi Tooltip Lines (Vertical and Horizontal) | Mouse-over the graph, and the X-axis value (annualised volatility'Annualised Volatility') and Y-axis value (annualised return'Annualised Return') will be shown on the respective axes. | Plot Element |
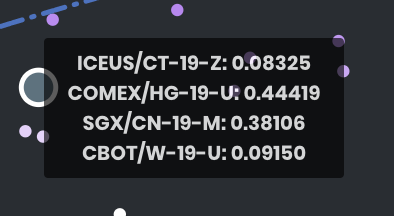
| Significant Points Tooltip | Displays the exact asset allocation of significant points upon mouse-over.
| Plot Element |
...