...
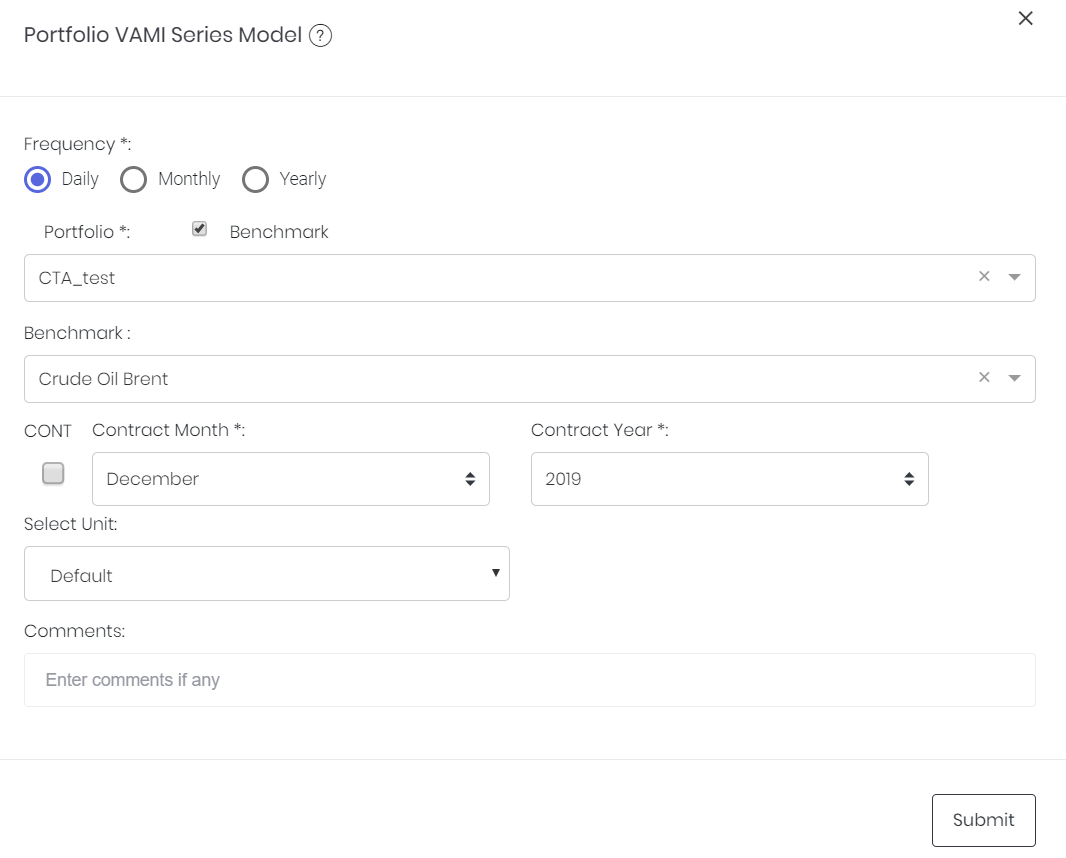
Input
Name | Description | Type | Example |
|---|---|---|---|
| Frequency | Resolution at which returns data are viewed. | Selection | Daily |
| Portfolio | Portfolio to be analysed. | Portfolio (Selection) | CTA_Test |
| Benchmark | Product to be used as a benchmark. | Product Name | Sugar #11 |
| Contract month. | Month | July | |
| Contract year. | Year | 2019 | |
| Continuous contract (for more information, please refer to Futures Continuous Contract Data Setting). | Checkbox | - | |
| Serial number of the starting futures contract (for more information, please refer to Futures Continuous Contract Data Setting). | Numerical Value | 1 | |
| Unit (for more information, please refer to Select Unit (Data Transformation Tool)). | Unit | Default | |
| Comments | Useful for documentation purposes or for settings description. | Text | - |
Output
| Name | Description | Type |
|---|---|---|
| Portfolio's Value-Added Monthly Index (VAMI) | Displays the value that a hypothetical initial investment of $1000 would have (Y-axis) on any date (X-axis). Shown as an orange shaded area. | Plot |
| Benchmark Time-Series | Displays the value of the hypothetical $1000 investment if it is put into the benchmark instead. Same axes as above; shown as a blue time-series. | Plot |
Example
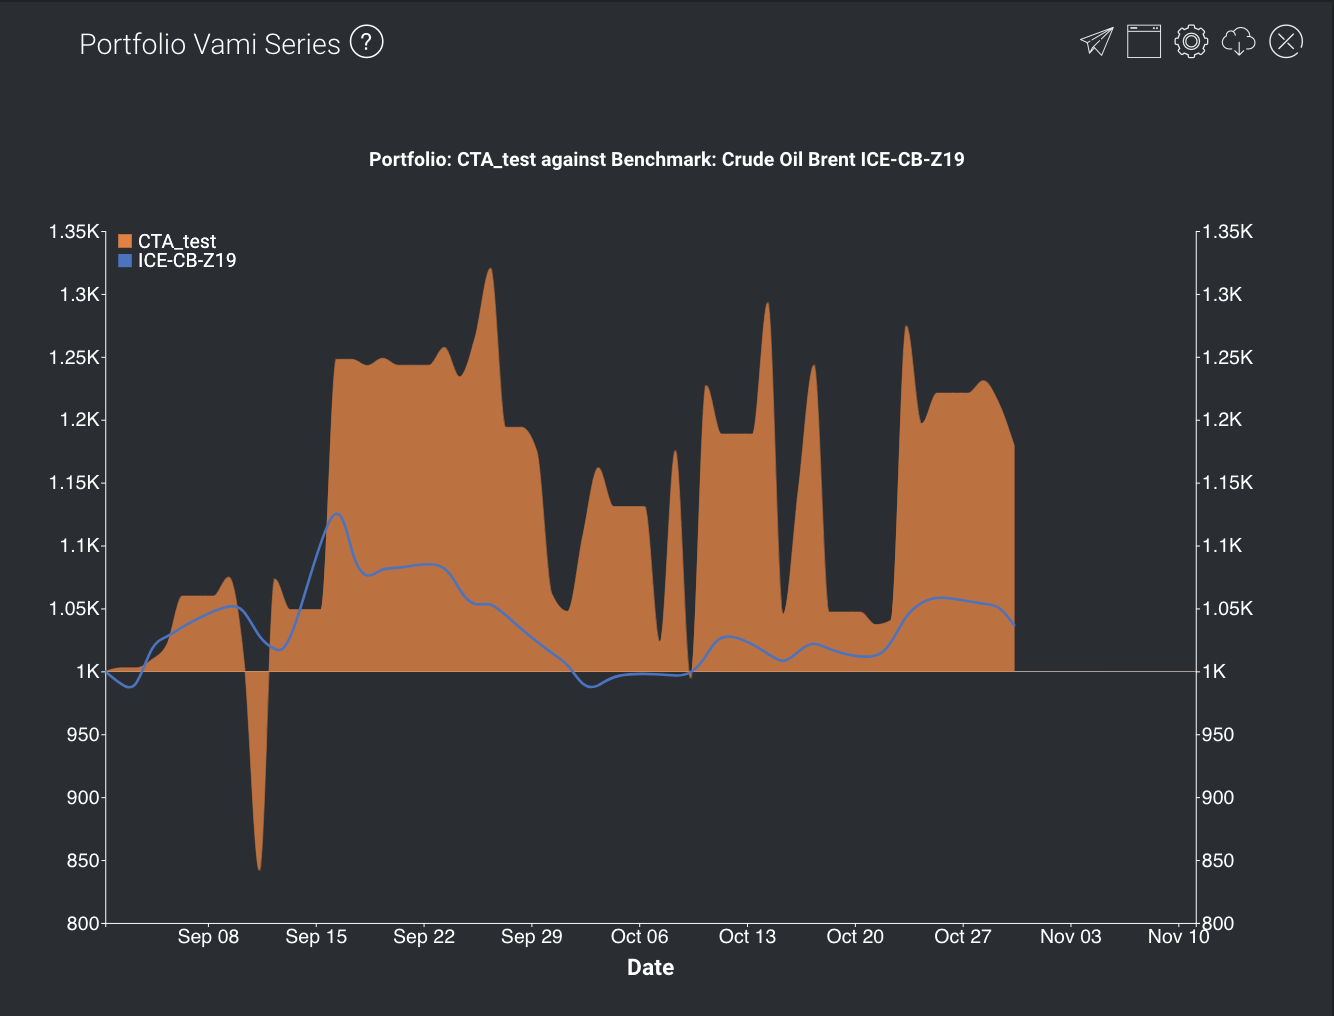
This portfolio's value seems to be fluctuating quite a bit, but investors would generally have made gains if they invested before September.
...